As2O3 Induces Oxidative Stress in Gill, Liver, Brain and Blood of Cyprinus carpio
Luis Gerardo Bernadac-Villegas, Dora Alicia Solís-Casados, Alba Yadira Corral-Avitia, Marcela Galar-Martínez, Hariz Islas-Flores, Octavio Dublán-García, Leobardo Manuel Gómez-Oliván
1 Environmental Toxicology Laboratory, Department of Chemistry, University of the State of Mexico, Toluca, Mexico Paseo Colon Paseo Tollocan intersection s / n. Col. Residencial Colón, Toluca, Estado de Mexico, Mexico, CP 50120;
2 Environmental Science Laboratory, Institute of Biomedical Sciences, University Autonomous of Ciudad Juarez, Juarez Mexico Av Benjamin Franklin no. 4650 PRONAF Zone Ciudad Juarez, Chihuahua, Mexico, CP 32315;
3 Laboratory of Aquatic Toxicology, Department of Pharmacy, National School of Biological Sciences, National Polytechnic Institute, Mexico DF, Mexico, Professional Unit Adolfo Lopez Mateos Av, Wilfrido Massieu Esq Cda Miguel Stampa s/n, Gustavo A Madero Mexico DF, Mexico, C.P 07738.
- Corresponding Author:
- Leobardo Manuel Gómez-Oliván
Environmental Toxicology Laboratory
Department of Chemistry, University of the State of Mexico
Toluca, Mexico Paseo Colon Paseo Tollocan intersection s / n. Col. Residencial Colón
Toluca, Estado de Mexico, Mexico, CP 50120
Tel: 52 7222173890
Fax: 52 7222173890
E-mail: lmgomezo@uaemex.mx; lgolivan74@gmail.com
Received date: January 26, 2016; Accepted date: February 01, 2016; Published date: February 07, 2016
Citation: Gómez-Oliván LM, Bernadac-Villegas LG, Solís-Casados DA, et al., As2O3 Induces Oxidative Stress in Gill, Liver, Brain and Blood of Cyprinus Carpio. Electronic J Biol, 12:1
Abstract
Background Arsenic (As) is a toxic trace element for diverse aquatic species. It is present naturally in water in diverse oxidation states and chemical species. During its biotransformation, As induces production of reactive oxygen species, eliciting oxidative stress in diverse organisms. This study aimed to evaluate As-induced toxicity in brain, liver, blood and gill of the common carp Cyprinus carpio.
Methods and Findings The following biomarkers were using to determine oxidative stress: hydroperoxide content, lipid peroxidation, protein carbonyl content and the antioxidant activity of the enzymes superoxide dismutase, catalase and glutathione peroxidase. Bioconcentration factor was analyzed. Exposure to 0.05 mg As2O3 L-1 induced changes in biomarkers of oxidative stress as well as antioxidant activity in all tissues evaluated (P<0.05), this damage being most evident in liver. BCF levels were higher on gill.
Conclusions The biomarkers used in this study are useful for early detection of As-induced toxicity in fish.
Keywords
Arsenic; Oxidative stress; Biomarkers; Cyprinus carpio; Bioconcentration factor; Gill
1. Introduction
Arsenic (As) is a widely distributed contaminant in diverse regions of the world [1]. Considered a toxic trace element, it is naturally present in water in diverse oxidation states and chemical species. The most abundant forms of this metal in nature are inorganic such as arsenite (AsIII) or arsenate (AsV), the former being the more toxic form [2].
In contrast to other metals, As mobilization in water is influenced by the pH of surface or ground water. A pH of 6.5 to 8.5 and oxidation-reduction conditions favor its movement in the water column [3]. This metal has been shown to be toxic to diverse aquatic species and humans. Studies of As toxicity on aquatic species have centered on: (1) increased cytotoxicity in cells of fish exposed to sodium arsenite [4,5]; (2) oxidative stress induction and reduced activity of antioxidant enzymes in polychaetes like Laeonereis acuta and fish such as Clarias batrachus exposed to As2O3 [6,7]; (3) increased antioxidant activity in gill of zebrafish Danio rerio exposed to AsV [8]; and (4) oxidative stress and changes in antioxidant systems in liver of goldfish (Carassius auratus) exposed to AsIII [9].
Thus, the contamination of water by As has become a serious environmental and human health problem [10]. In water, As is normally present as AsV, affecting aquatic species directly. When ingested by humans or other mammals in water or through contaminated foods, AsV is metabolized to AsIII and conjugated to organic molecules forming methyl arsenic [11]. The release of this metal into aquatic ecosystems due to diverse anthropogenic activities results in its accumulation at high concentrations in water, sediments, fish and benthic invertebrates [12].
One-way to evaluate the impact of As presence is the use of biomarkers such as oxidative stress. The latter phenomenon is produced by a change in the balance between reactive oxygen species (ROS) and antioxidant defense systems of the organism [13]. ROS include among other free radicals the superoxide anion (O2), hydroxyl (OH) and hydrogen peroxide (H2O2) radicals [14]. Diverse studies have shown that exposure to different contaminants, including As, induces ROS production in the cell [15], eliciting increased lipid peroxidation (LPX) and changes in the activity of diverse antioxidant enzymes such as superoxide dismutase (SOD), catalase (CAT) and glutathione peroxidase (GPx) [14,16].
Arsenic compounds that induce production of ROS and reactive nitrogen species (RNS) elicit oxidation of cell lipids, proteins and DNA [17]. Antioxidant defense systems play a fundamental role in the preservation of cellular stability as well as the maintenance of a strict control of free radicals [18]. The common carp Cyprinus carpio is frequently used as a bioindicator since it is a major commercial fish species due to its high protein and low fat content as well as its high resistance and easy maintenance [19]. This organism tolerates cold temperatures, low dissolved oxygen conditions and high pH, ammonium, nitrate, nitrite and phosphate levels [20]. The present study aimed to evaluate As-induced toxicity in tissues (brain, liver, blood and gill) of C. carpio, using oxidative stress biomarkers.
2. Method
Unless otherwise stated, reagents were purchased from Sigma-Aldrich (St. Louis MO).
2.1 Oxidative stress determination
A total of 100 common carp (Cyprinus carpio) 10.3 ± 0.53 cm in length and weighing 6.4 ± 0.45 g were obtained from the aquaculture facility in Tiacaque (State of Mexico), transported to the laboratory in polyethylene bags with oxygenated water, and placed in 200 L tanks containing unchlorinated water reconstituted: NaHCO3 (174 mg/L), MgSO4 (120 mg/L), KCl (8 mg/L) and CaSO4.2H2O (120 mg/L), at 20 ± 2ºC temperature, 80-90% oxygen concentration, 17.5 ± 6.3 mg/L total alkalinity and 18.7 ± 0.6 mg/L total hardness, and acclimated for 30 days prior to the experiment. During acclimation, specimens were fed Pedregal SilverTM fish food and at least 3/4 of the tank water was replaced every 24 h. A natural 12:12 h light:dark photoperiod was maintained.
Two groups (control and exposed) of 10 fish each were placed in 4 L with reconstituted water. To the water of exposed groups was added 0.05 mg/L of As2O3, equivalent to the maximum permissible limit laid down in the official norm [21] on environmental health and water for human use and consumption, and fish were exposed for 12, 24, 48, 72 and 96 h, with no food provided.
At the end of the experiment, fish were anesthetized with clove oil for 3-5 min [22] and blood was collected using heparinized 1-mL hypodermic syringes. Blood samples were frozen at -70ºC prior to analysis. Specimens were then placed on ice and sacrificed to remove the gills, brain and liver, which were placed in phosphate, buffer solution [0.138 M NaCl; 0.0027 KCl (Vetec-Sigma-Aldrich, Mexico)] pH 7.4. The supernatant was centrifuged at 12,500 rpm and -4ºC for 15 min. Tissue samples were frozen at -70ºC prior to analysis.
Determination of HPC: Hydroperoxide content (HPC) was determined by the ferrous oxidationxylenol orange method [23]. To 100 μL of supernatantpreviously deproteinized with 10% trichloroacetic acid (TCA) – was added 900 μL of the reaction mixture [0.25 mM FeSO4, 25 mM H2SO4, 0.1 mM xylenol orange and 4 mM butyl hydroxytoluene in 90% (v/v) methanol], incubating for 60 min at room temperature. Absorbance was read at 560 nm against a blank containing only reaction mixture. Results were interpolated on a type curve and expressed as nM cumene hydroperoxide/mg protein.
Determination of LPX: LPX was determined using the thiobarbituric acid-reactive substances method [24]. To 100 mL of supernatant was added Tris- HCl buffer solution pH 7.4 until a 1 mL volume was attained. Samples were incubated at 37ºC for 30 min; 2 mL TBA-TCA reagent [0.375% thiobarbituric acid (Fluka-Sigma-Aldrich, Mexico) in 15% TCA] was added and the samples were shaken in a vortex, heated to boiling for 45 min, allowed to cool and the precipitate removed by centrifugation for 10 min at 3,000 rpm. Absorbance was read at 535 nm against a reaction blank. LPX was calculated using the molar extinction coefficient (MEC) of malondialdehyde (MDA) (1.56 × 10⁵ M/cm). Results were expressed as mM MDA/mg protein.
Determination of PCC: PCC was determined using the method of Levine et al. [25]. To 100 μL of supernatant was added 150 μL of 10 mM DNPH in 2 M HCl and the resulting solution was incubated at room temperature for 1 h in the dark. Next, 500 μL of 20% TCA was added and the solution allowed to rest for 15 min at 4ºC. The precipitate was centrifuged at 11,000 rpm for 5 min. The bud was washed three times with 1:1 ethanol:ethyl acetate, then dissolved in 1 mL of 6 M guanidine solution (pH 2.3) and incubated at 37ºC for 30 min. Absorbance was read at 366 nm. Results were expressed as nM reactive carbonyls formed (C=O) /mg protein, using the MEC of 21,000 M/cm.
Determination of SOD activity: SOD activity was determined by the Misra and Fridovich method [26]. To 40 μL of supernatant in a 1-cm cuvette was added 260 μL carbonate buffer solution (50 mM sodium carbonate and 0.1 mM EDTA) pH 10.2, plus 200 μL adrenaline (30 mM). Absorbance was read at 480 nm after 30 s and 5 min. Activity was determined using the MEC of SOD (21 M/cm). Results were expressed as mM SOD/mg protein.
Determination of CAT activity: CAT activity was determined by the Radi et al. method [27]. To 20 mL of supernatant was added 1 mL isolation buffer solution (1 mL EDTA, 5 mM HEPES, 0.3 M saccharose, 5 mM KH2PO4) plus 0.2 mL hydrogen peroxide solution (20 mM); the last three reagents Vetec-Sigma-Aldrich (St. Louis). Absorbance was read at 240 nm, at 0 and 60 s. Results were derived by substituting the absorbance value obtained for each of these times in the formula: CAT concentration = (A0-A60)/MEC) where the MEC of H2O2 is 0.043 mM/cm, and were expressed as μM H2O2/mg protein.
Determination of GPx activity: GPx activity was determined by the method of Gunzler and Flohe- Clairborne [28]. To 100 μL of supernatant was added 10 μL glutathione reductase (2 U glutathione reductase) and 290 μL reaction buffer [3.5 mM reduced glutathione, 1 mM sodium azide, 0.12 mM NADPH, 50 mM K2HPO4 and 50 mM KH2PO4 pH 7.0] plus 100 μL H2O2 (0.8 mM); the last three reagents Vetec. Absorbance was read at 340 nm, at 0 and 60 s. Enzyme activity was estimated using the equation: GPx concentration= (A0-A60)/MEC), where the MEC of NADPH=6.2 mM/cm. Results were expressed as mM NADPH/mg protein.
Protein determination: Total protein content was determined by the Bradford method [29]. To 25 μL of supernatant was added 75 μL deionized water and 2.5 mL Bradford’s reagent [0.05 g Coomassie Blue dye, 25 mL of 96% ethanol, and 50 mL H3PO4, in 500 mL deionized water]. Test tubes were shaken and allowed to rest for 5 min prior to reading absorbance at 595 nm and interpolation on a bovine albumin curve (Sigma-Aldrich, St. Louis).
2.2 Bioconcentration factor analysis (BCF)
10 fish in the system were placed in 4 L with reconstituted water. To the water was added 0.05 mg/L of As2O3, equivalent to the maximum permissible limit laid down in the official norm [21] on environmental health and water for human use and consumption, and fish were exposed for 12, 24, 48, 72 and 96 h, with no food provided.
At the end of the experiment, fish were anesthetized with clove oil for 3-5 min [22] and blood was collected using heparinized 1-mL hypodermic syringes. Blood samples were frozen at -20ºC prior to analysis. Specimens were then placed on ice and sacrificed to remove the gills, brain and liver, which were placed in phosphate, buffer solution [0.138 M NaCl; 0.0027 KCl (Vetec-Sigma-Aldrich, Mexico)] pH 7.4. Tissue samples were frozen at -20ºC prior to analysis.
Bioconcentration analysis was performed on all Cyprinus carpio tissues and blood. Prior to the arsenic determination by Graphite Furnace Atomic Absortion Spectometry (GFAAS; PinAAcle 900) with a 0.05 μL detection limit, samples were digested using 10% nitric acid in microwave digestor (Titan MPS™- PerkinElmer). An arsenic master standard solution containing 1000 mg/L of arsenic was obtained from Fisher Scientific. This was diluted with 2% nitric acid to provide the working solution of 0.05 mg L-1 and standards required. The Method specifies the use of a matrix modifier containing both palladium and magnesium. BCF was determined using the following formula:
BCFfish=Cfish/Cwater
Where
Cfish is the concentration of As in tissue of Cyprinus carpio
Cwater is the concentration found in water of exposure
BCFfish is the bioconcentration factor for the organisms
2.3 Statistical analysis
Toxicity assay results were statistically evaluated. After replication of the normality test, differences were determined by one-way analysis of variance (ANOVA) followed by Bonferroni’s multiple comparisons test (95% confidence limit) whenever the difference was significant. StatPlus:mac v2009 (AnalystSoft, Spain) was used.
3. Results
3.1 HPC
HPC results are shown in Figure 1. Significant differences (P<0.05) with respect to the control group occurred in all tissues evaluated during at least one exposure time. Significant increases were found in gill at 12 h (121.1%), brain at 72 h (196.8%), liver at 48 h (124.7%) and blood at 12, 24, 48, 72 and 96 h (1273, 1318, 2066, 2882 and 1433% respectively), while significant reductions took place in brain at 24 h (51.47%) and liver at 24 h (50.99%) and 72 h (51.73%). Damage in terms of this biomarker was most evident in blood.

Figure 1: Hydroperoxide content (HPC) in gill, brain, liver and blood of Cyprinus carpio exposed to arsenic. Values are the mean of three replicates ± SEM. CHP cumene hydroperoxide. *Significantly different from control values, ANOVA and Bonferroni’s (P<0.05). Significant difference with respect to: a 12 h; b 24 h; c 48 h; d 72 h; e 96 h (P<0.05). N=100 fish.
3.2 LPX
LPX results in our study are shown in Figure 2. Significant increases (P<0.05) with respect to control values were found in brain at 72 h (142.42%) and blood at 24 h (148.8%). Significant reductions occurred in gill at 96 h (74.3%) and liver at 12, 24, 72 and 96 h (36, 42.2, 32.5 and 25% respectively), the liver being the organ most damaged.
3.3 PCC
Figure 3 shows PCC results; significant differences in gill at 48 h (59.3%) and 96 h (62.7%) and brain at 24 h (41.7%). Damage was highest in liver, with reductions occurring at 12, 24, 72 and 96 h (46.8, 38.9, 49 and 61.3% respectively).
3.4 SOD activity
SOD activity results are shown in Figure 4. A significant increase with respect to the control group (P<0.05) occurred in brain at 24 h (64.2%) and 72 h (198.6%) while significant increases in liver and blood were observed only at 72 h (36.7%) and 24 h (212.6%) respectively. No significant differences with respect to the control group were found in gill. Studies determining the effect of this biomarker in fish are limited, but SOD activity has been evaluated in mammals such as rat with contrasting results are seen with respect to the control group (P<0.05). Increases occurred in brain at 48 h (20%) and blood at 24 h (69.2%). In contrast, reductions took place

Figure 2: Lipid peroxidation (LPX) in gill, brain, liver and blood of C. carpio exposed to arsenic. Values are the mean of three replicates ± SEM. MDA malondialdehyde. *Significantly different from control values, ANOVA and Bonferroni’s (P<0.05). Significant difference with respect to: a 12 h; b 24 h; c 48 h; d 72 h; e 96 h (P<0.05). N=100 fish.
3.5 CAT activity
Figure 5 shows CAT activity results. Significant increases with respect to control values (P<0.05) occurred in blood at 12 h (146%) and brain at 72 h (133.6%) while significant reductions took place in gill at 24 h (50.6%), brain at 24 h (21%) and 96 h (47%), blood at 48 h (46%), and liver at 12, 24, 72 and 96 h (30.4, 13.3, 6.5 and 28% respectively).

Figure 3: Protein carbonyl content (PCC) in gill, brain, liver and blood of C. carpio exposed to arsenic. Values are the mean of three replicates ± SEM. *Significantly different from control values, ANOVA and Bonferroni’s (P<0.05). Significant difference with respect to: a 12 h; b 24 h; c 48 h; d 72 h; e 96 h (P<0.05). N=100 fish.

Figure 4: Superoxide dismutase (SOD) activity in gill, brain, liver and blood of C. carpio exposed to arsenic. Values are the mean of three replicates ± SEM. *Significantly different from control values, ANOVA and Bonferroni’s (P<0.05). Significant difference (P<0.05) with respect to: a 12 h; b 24 h; c 48 h; d 72 h; e 96 h. N=100 fish.

Figure 5: Catalase (CAT) activity in gill, brain, liver and blood of C. carpio exposed to arsenic. Values are the mean of three replicates ± SEM. *Significantly different from control values, ANOVA and Bonferroni’s (P<0.05). Significant difference (P<0.05) with respect to: a 12 h; b 24 h; c 48 h; d 72 h; e 96 h. N=100 fish.
3.6 GPx activity
GPx results are shown in Figure 6. Significant reductions with respect to control values (P<0.05) occurred in gill at 12, 48 and 96 h (67, 32 and 41.6% respectively) and liver at 24, 72 and 96 h (23.7, 10.88 and 15.42% respectively). Damage was most evident in brain, with decreases at 12, 24, 48 and 96 h (65.2, 7, 46.7 and 50% respectively).

Figure 6: Glutathione peroxidase (GPx) activity in gill, brain and liver of C. carpio exposed to arsenic. Values are the mean of three replicates ± SEM. *Significantly different from control values, ANOVA and Bonferroni’s (P<0.05). Significant difference (P<0.05) with respect to: a 12 h; b 24 h; c 48 h; d 72 h; e 96 h. N=100 fish.
3.7 BCF determination
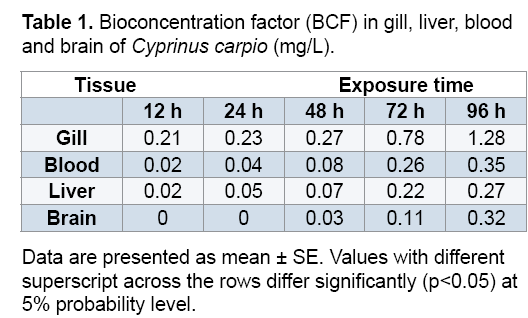
As can be seen in Table 1, BCF range from 0.02 to 1.28. The highest BCF was found on gill significantly at 96 h.
4. Discussion
Arsenic is a very common natural contaminant, which is readily bioaccumulated in diverse tissues [30]. Mechanisms of As toxicity involve numerous proteins and enzymes that contain sulfhydryl groups which are modified by As. At the cellular level, AsIII and AsV metabolites act through different mechanisms; AsV is similar in structure to inorganic phosphate and consequently vies with the latter in ATP production, decoupling oxidative phosphorylation through the formation of an unstable arsenate ester, which is spontaneously hydrolyzed [11].
The HPC results (Figure 1) may be explained by the fact that As attacks the mitochondrion directly, affecting electron transport during cellular respiration and inducing increased ROS formation [31], giving rise to the hydroxyl radical (HO*, which is measured directly in this test). During LPX, double-chain polyunsaturated fatty acids react with ROS–particularly HO* and RNS like peroxynitrite (ONOO-) – through a chain reaction mechanism enabling formation of hydroperoxides [32]. These findings are consistent with a study by Bhattacharya and Bhattacharya [6], where increased production of H2O2 occurred in the fish Clarias batrachus after exposure to 84 mg/L of As.
Free radicals present as a result of the biotransformation of As components or the accumulation of As in tissues induced oxidation on cell components – mainly lipids and proteins – and an increase was observed in oxidative stress markers in the cell such as MDA. A study by Altikat et al. [33] reports a significant increase in hepatic MDA levels due to As accumulation in Cyprinus carpio exposed to this metal. These results are consistent with Bagnyukova et al. [9], who report increased LPX in liver of goldfish Coryphaena hippurus exposed to 200 μM NaAsO2. A similar behavior was observed by Bhattacharya and Bhattacharya [6] in liver of Clarias batrachus as well as Ventura-Lima et al. [34] in liver and gill of Cyprinus carpio after exposure to 84 mg As L-1 and 1000 μg As L-1 respectively. All these studies concluded that LPX increases were concentration and time dependent, being greater at low As concentrations (μg/L) and prolonged exposure periods (>48 h) as observed in Figure 2.
Significant PCC increases as shown in Figure 3 may also be due to the fact that ROS remove protons from methylene groups in amino acids, forming carbonyls that bind to proteins and induce damage on nucleophilic centers, oxidation of sulfhydryl groups and peptide fragmentation, culminating in loss of protein function [35]. de Castro et al. [36] report increased PCC in brain of D. rerio exposed to 100 μg/L of As for 96 h. The latter authors conclude that an increase in PCC under oxidation conditions may elicit a high percentage of dysfunctional proteins, which are major contributors to oxidative stress-induced cell damage and death. Some studies report a significant correlation between exposure to As and protein oxidation in fish such as D. rerio. This oxidation is induced by the interaction of ROS (*OH, O2 -) with proteins. Also, As attacks the mitochondrion producing peroxynitrites (formed by coupling of the superoxide anion to nitric oxide). It is worth noting that the latter compounds have a high affinity for protein sulfhydryl groups and induce increases in protein carbonylation [37,38].
Diverse environmental contaminants – such as arsenic – can induce antioxidant defenses [39]. SOD is the first mechanism of antioxidant defense and the main enzyme responsible for offsetting the effects of ROS, particularly the superoxide ion [40] which it converts to hydrogen peroxide (Figure 4). SOD catalyzes the dismutation of superoxide anion, preventing hydroxyl radical formation [41]. Subsequently, H2O2 is sequestered and degraded to H2O by CAT and GPx. A study by Jain et al. [42] found no significant changes in SOD activity in brain, liver and blood of rat exposed to 0.325, 1.3 and 2.5 mg/Kg of As, while Bharti et al. [43] found a significant reduction in this biomarker in female rats exposed to 100 mg/L of AsIII. Both studies conclude that the effect of As on SOD activity is age, sex and time dependent. According to Livingstone [44], increases in SOD activity in fish and other aquatic organisms are due to the high levels of superoxide anion induced by exposure to diverse environmental contaminants including As. The species studied include Atlantic flounder (Platichthys flesus), bluegill sunfish (Lepomis macrochirus), catfish (Ictalurus punctatus), perch (Perca fluviatilis), rainbow trout (Oncorhynchus mykiss), larval turbot (Scophthalmus maximus), starfish (Asterias rubens), shore crab (Carcinus maenas) and common mussel (Mytilus edulis). Bagnyukova et al. [9] say LPX products and ROS seem to be involved in the upregulation and down regulation of several antioxidant enzymes such as SOD, CAT and GPx.
According to Coban et al. [45] the superoxide radical also inhibits the activity of CAT, which has a major role in protecting the cell against ROS. The increases in this biomarker in gill and brain observed in Figure 5 are consistent with Battacharya and Battacharya [6] who report increased CAT activity in liver of Clarias batrachus exposed to 84 mg/L of As for 48 h. On the other hand, Ventura-Lima et al. [34] found no changes in CAT activity in zebrafish exposed to 10 μg/L of As for 48 h. These authors conclude that antioxidant activity in response to As toxicity may differ depending on the type of tissue evaluated. The reductions in this biomarker in our study may be explained by ROS and NOS production, which in excess can promote a negative feedback inhibiting CAT activity [9].
Arsenic can inhibit GPx, SOD and CAT among other antioxidant enzymes, as shown by Flora et al. [1] in rat exposed to 100 mg/L As L. The GPx results (Figure 6) are consistent with those of Maiti and Chatterjee [46], who also report a reduction in GPx activity in rat after exposure to 15.86 mg/Kg AsIII. Arsenic induces increased GPx activity in diverse model systems and is involved in induction of oxidative stress. Previous studies have shown that the major H2O2-removing enzymes associated with As toxicity are GPx and CAT, although GPx may be more effective against As-induced ROS formation, probably due to its cytosolic localization [47].
Bioconcentration factor (BCF) of gill, blood, liver and brain tissue of Cyprinus carpio are shown on Table 1. This analysis showed that there is appreciable concentration of As in all tissues. However, there were higher BCF levels in gill compare to the others. There is a time-dependant correlation between the As found in tissues from water. BCF is in the order gill>blood>liver>brain. The high concentration of As in gill could be attributed to element complexion with the mucus coverings the gill, which cannot be completely eliminated from the gill lamellae before analysis and also since it is the first tissue to be in contact with contaminants in water such as As [48]. The use of As-based pesticides can increase the concentration of this contaminant; which may be transferred to food thereby promoting adverse effects on aquatic organisms through runoff from agricultural soils to water bodies [49].
5. Conclusion
Exposure to 0.05 mg/L of As induced oxidative stress in gill, brain, liver and blood of Cyprinus carpio. The highest BCF was found on gill significantly at 96 h. The biomarkers used in the present study are useful for early detection of As-induced toxicity in fish.
Acknowledgement
This study was made possible through financial support from the Secretaría de Investigación y Estudios Avanzados of the Universidad Autónoma del Estado de México (SIEA-UAEM, project UAEM 3722/2014/CID).
References
- Flora SJS, Bhadauria S, Pant SC, Dhaket RK.(2005). Arsenic induced blood and brain oxidative stress and its response to some thiol chelators in rats. Life Sci. 77: 2324-2337.
- Akter K, Owens FG, Davey DE, Naidu R.(2005).Arsenic speciation and toxicity in biological systems. Rev Environ Contam Toxicol. 184: 97-149.
- Baeyens W, De Brauwere A, Brion N, De Gieter M, Leermakers M.(2007). Arsenic speciation in the River Zenne, Belgium. Sci Total Environ. 384: 409-419.
- Wang YC, Chaung RH, Tung LC. (2004). Comparison of the cytotoxicity induced by different exposure to sodium arsenite in two fish cell lines. Aquat Toxicol. 69: 67-79.
- Seok SH, Baek MW, Lee HY, et al. (2007). Arsenite-induced apoptosis is prevented by antioxidants in zebrafish liver cell line. Toxicol Vitro. 21: 870-877.
- Bhattacharya A, Bhattacharya S. (2007). Induction of oxidative stress by arsenic in Clarias batrachus : involvement of peroxisomes. Ecotox Environ Saf. 68: 178-187.
- Ventura-Lima J, Sandrini JZ, Ferreira-Cravo, et al. (2007). Toxicological responses in Laeonereis acuta (Annelida, Polychaeta) after arsenic exposure. Environ Int. 33: 559-564.
- Ventura-Lima J, Fattorini D, Regoli F, Monserrat JM.(2009). Effects of different inorganic arsenic species in Cyprinus carpio (Cyprinidae) tissues after short-time exposure: Bioaccumulation, biotransformation and biological responses. Environ Pollut. 157: 3479-3484.
- Bagnyukova TV, Chahrak OI, Lushchak VI. (2006). Coordinated response of goldfish antioxidant defenses to environmental stress. Aquat Toxicol. 78: 325-331.
- Allen T, Rana S. (2004). Effect of arsenic (AsIII) on glutathione-dependent enzymes in liver and kidney of the freshwater fish Channa punctatus . Biol Trace Elem Res. 100: 39-48.
- Thomas DJ, Styblo M, Lin S. (2001). The cellular metabolism and systemic toxicity of arsenic. Toxicol Appl Pharmacol. 176: 127-144.
- Culioli JL, Calendini S, Mori C, Orsini A.(2009). Arsenic accumulation in a freshwater fish living in a contaminated river of Corsica, France. Ecotox Environ Saf. 72: 1440-1445.
- Barata C, Navarro JC, Varo I, et al. (2005) Changes in antioxidant enzyme activities, fatty acid composition and lipid peroxidation in Daphnia magna during the aging process. Comp Biochem Physiol B-Biochem Mol Biol. 140: 81-90.
- Lushchak VI. (2011). Adaptive response to oxidative stress: Bacteria, fungi, plants and animals. Comp Biochem Physiol C-Toxicol Pharmacol. 153: 175-190.
- Ruas CB, Carvalho S, de Araújo HS, Espíndola EL, Fernandes MN.(2008).Oxidative stress biomarkers of exposure in the blood of cichlid species from a metal-contaminated river. Ecotox Environ Saf .71: 86-93.
- Valko M, Morris H, Cronin MT. (2005). Metals, toxicity and oxidative stress. Curr Med Chem. 12: 1161-1208.
- Volodymyr IL. (2011). Environmentally induced oxidative stress in aquatic animals. Aquat Toxicol . 101: 13-30.
- Halliwell B, Gutteridge JMC. (1989). Free radicals in biology and medicine, 2nd ed. Oxford: Clarendon Pres.
- Huang DJ, Zhang YM, Song G, et al. (2007) Contaminants-induced oxidative damage on the carp Cyprinus carpio collected from the Upper Yellow River, China. Environ Monit Assess. 128: 483-488.
- Koehn JD. (2004). Carpa (Cyprinus carpio ) como invasor de gran alcance en canales australianos. Biología de Agua Dulce .49: 882-894.
- NOM-127-SSA1-1994 Norma Oficial Mexicana. Salud ambiental, agua para uso y consumo humano – Límites permisibles de calidad y tratamientos a que debe someterse el agua para su potabilización. Diario Oficial de la Federación. 30: 11-1994.
- Yamanaka H, Sogabe A, Handoh IC, Kawabat Z. (2011). The effectiveness of clove oil as an anaesthetic on adult common carp, Cyprinus carpio L. J Anim Vet Adv. 10: 210-213.
- Jiang ZY, Hunt JV, Wolff SP. (1992). Ferrous ion oxidation in the presence of xylenol orange for detection of lipid hydroperoxide in low density lipoprotein.Anal Biochem. 202: 384-389.
- Büege JA, Aust SD. (1978). Microsomal lipid peroxidation. Methods Enzymol. 52: 302-310.
- Levine RL, Williams JA, Stadtman ER, Shacter E. (1994). Carbonyl assays for determination of oxidatively modified proteins. Methods Enzymol. 233: 346-357.
- Misra HP, Fridovich I. (1972). The role of superoxide anion in the autoxidation of epinephrine and a simple assay for superoxide dismutase. J Biol Chem . 247: 3170-3175.
- Radi R, Turrens JF, Chang LY, et al. (1991). Detection of catalase in rat heart mitochondria. J Biol Chem. 266: 22028-22034.
- Gunzler W, Flohe-Clairborne A. (1985). Glutathione peroxidase. In: Green-Wald RA (ed) Handbook of methods for oxygen radical research. Boca Raton: CRC Press. 285-290.
- Bradford MM. (1976). A rapid and sensitive method for the quantitation of microgram quantities of protein utilizing the principle of protein-dye binding. Anal Biochem .72: 248-254.
- Farombi EO, Adelowo OA, Ajimoko YR. (2007). Biomarkers of oxidative stress and heavy metal levels as indicators of environmental pollution in African cat fish (Clarias gariepinus ) from Nigeria Ogun River. Int J Environ Health Res. 4: 158-165.
- Yamanaka K, Okada S. (1994). Induction of lung-specific DNA-damage by metabolically methylated arsenics via the production of free-radicals. Environ Health Perspect. 102: 37-40.
- Filho WD, Torres MA, Zaniboni-Filho E, Pedrosa RC.(2005). Effect of different oxygen tensions on weight gain, feed conversion, and antioxidant status in piapara, Leporinus elongatus (Valenciennes 1847). Aquaculture. 244: 349-357.
- Altikat S, Uysal K, Kuru H, et al. (2014).The effect of arsenic on some antioxidant enzyme activities and lipid peroxidation in various tissues of mirror carp (Cyprinus carpio carpio ). Environ Sci Pollut Res Int . 22: 3212-3218.
- Ventura-Lima J, Fattorini D, Regoli F, Monserrat JM.(2009). Effects of different inorganic arsenic species in Cyprinus carpio (Cyprinidae) tissues after short-time exposure: Bioaccumulation, biotransformation and biological responses. Environ Pollut. 157: 3479-3484.
- Parvez S, Raisuddin S. (2005). Protein carbonyls: novel biomarkers of exposure to oxidative stress-inducing pesticides in freshwater fish Channa punctata (Bloch). Environ Toxicol Pharmacol .20: 112-117.
- De Castro M, Lima J, de Freitas DP, et al. (2009).Behavioral and neurotoxic effects of arsenic exposure in zebrafish (Danio rerio , Teleostei: Cyprinidae). Comp Biochem Physiol C-Toxicol Pharmacol . 150: 337-342.
- Kotsanis N, Iliopoulou-Georgudaki J. (1999). Arsenic induced liver hyperplasia and kidney fibrosis in rainbow trout Oncorhynchus mykiss by microinjection technique: a sensitive animal bioassay for environmental metal-toxicity. Bull Environ Contam Toxicol. 52: 169-178.
- Pedlar RM, Ptashynski M, Evans R, Klaverkamp JF. (2002). Toxicological effects of dietary arsenic exposure in lake whitefish (Coregonus clupeaformis ). Aquat Toxicol. 57: 167-89.
- Vlahogianni T, Dassenakis M, Scoullos MJ, Valavanidis A. (2007).Integrated use of biomarkers (superoxide dismutase, catalase and lipid peroxidation) in mussels Mytilus galloprovincialis for assessing heavy metals’ pollution in coastal areas from the Saronikos Gulf of Greece. Mar Pollut Bull .54: 1361-1371.
- Van der Oost R, Beyer J, Vermeulen NP (2003) Fish bioaccumulation and biomarkers in environmental risk assessment: a review. Environ Toxicol Pharmacol. 13: 57-149.
- Wang L, Xu ZR, Jia XY, Jiaang JF, Han XY.(2006). Effects of arsenic (AsIII) on lipid peroxidation, glutathione content and antioxidant enzymes in growing pigs. Asian-Australas J Anim Sci .19: 727-733.
- Jain A, Flora G, Bhargava R, Flora SJF.(2012). Influence of age on arsenic-induced oxidative stress in rat. Biol Trace Elem Res. 149: 382-390.
- Bharti VK, Srivastava RS, Sharma B. (2012). Buffalo (Bubalus bubalis ) epiphyseal proteins counteract arsenic induced oxidative stress in brain, heart, and liver of female rats. Biol Trace Elem Res .146: 224-229.
- Livingstone DR. (2003). Oxidative stress in aquatic organisms in relation to pollution and aquaculture. Rev Med Vet. 154: 427-430.
- Coban A, Ciftci M, Ozdemir H.(2007). Purification and characterization of catalase enzymes from chicken liver and sheep erythrocytes. Asian J Chem. 19: 3941-3953.
- Maiti S, Chatterjee AK. (2001). Effects on levels of glutathione and some related enzymes in tissues after an acute arsenic exposure in rats and their relationship to dietary protein deficiency. Arch Toxicol .75: 531-537.
- Wang YC, Chaung RH, Tung LC. (2004). Comparison of the cytotoxicity induced by different exposure to sodium arsenite in two fish cell lines. Aquat Toxicol. 69: 67-79.
- Khalil M, Faragallah H. (2008). The distribution of some leachable and total heavy metals in core sediments of Manzala Lagoon, Egypt. Journal of Aquatic Research . 34: 1-11.
- Conceic?a?o FT, Navarro GRB, Silva AM. (2013). Anthropogenic influences on Cd, Cr, Cu, Ni, Pb and Zn concentrations in soils and sediments in a watershed with sugar cane crops at Sa?o Paulo State. Brazil. Int J Environ Res. 7: 551–560.


Open Access Journals
- Aquaculture & Veterinary Science
- Chemistry & Chemical Sciences
- Clinical Sciences
- Engineering
- General Science
- Genetics & Molecular Biology
- Health Care & Nursing
- Immunology & Microbiology
- Materials Science
- Mathematics & Physics
- Medical Sciences
- Neurology & Psychiatry
- Oncology & Cancer Science
- Pharmaceutical Sciences