Three Very Different UV-VIS Absorption Spectra of Three Different Transition Metals Found in Biological Solutions
Yahia Z Hamada, Nyasha Makoni, Hasan Hamada
Department of Natural and Mathematical Sciences, LeMoyne-Owen College, USA.
Received date: November 16, 2016; Accepted date: December 19, 2016; Published date: December 26, 2016
Citation: Hamada YZ, Makoni N, Hamada H. Three Very Different UV-VIS Absorption Spectra of Three Different Transition Metals Found in Biological Solutions. Electronic J Biol, S:2
Abstract
We are introducing three colorful experimental models using typical spectrophotometer that are appropriate for undergraduate analytical chemistry, general chemistry, biochemistry, and biology students. One of the main aims of this paper is to make a comparison between the nature and the source of the colors that different chemical samples possess using UV-Visspectroscopy. The chemical samples are naturally occurring such as chlorophyll and simple inorganic salts such as Chromium (III) and Permanganate in aqueous solutions. The maximum absorption peaks for Permanganate appeared at 310 and 530 nm. The chlorophyll peaks appeared at 440 and 660 nm. The Chromium (III) peaks appeared at 300, 420 and 580 nm. The rationales behind these colored solutions and the appearance of these peaks are discussed and explained.
Keywords
Analytical chemistry; Biology classes; Biochemistry; Metal ions; Colored solutions; UV-Vis Spectroscopy.
1. Introduction
Selecting the proper experimental techniques without sacrificing academic quality or scientific merit in the undergraduate laboratory is a challenge. In addition, selecting experimental set-up that fits the undergraduate laboratory time frame is not an easy task. Reported here are three affordable and userfriendly experimental models that fit the time frame and the budget of most institutions. Many students (in fact most biology teachers) do not understand the concepts behind the colors of some solutions that they are working with. For example, why the color of the green leaves or (Chlorophyll) is green. An extensive literature survey showed that some papers were published more than 70 years ago and as recent as 2004 discussed the chemistry of chlorophyll [1-9]. Most of these reports presented extraction, chromatographic separation methods or improved methods of chromatographic extraction. None among the papers found discussed the rationale behind the source and the nature of the green color of the plant pigments. References 4 and 6 were the only two to show the absorption spectra for plant pigments without explaining the source and the nature of the colors. Reference 4 focused on the Hard Soft Acid Base principle and the exchange of Magnesium with Copper and Zinc [4]. Reference 6 focused on performing thin-layer chromatography and column chromatography on the isolated plant pigments [6]. Presented here is a more detailed and accurate account of the generated absorption spectra for the isolated plant pigments as well as comparing their UV-visible absorption spectra with the absorption spectra of two different inorganic samples commonly found in undergraduate biology and chemistry laboratories.
2. Materials and Method are Described in Each Model
Model 1
Potassium permanganate and its visible absorption spectroscopy
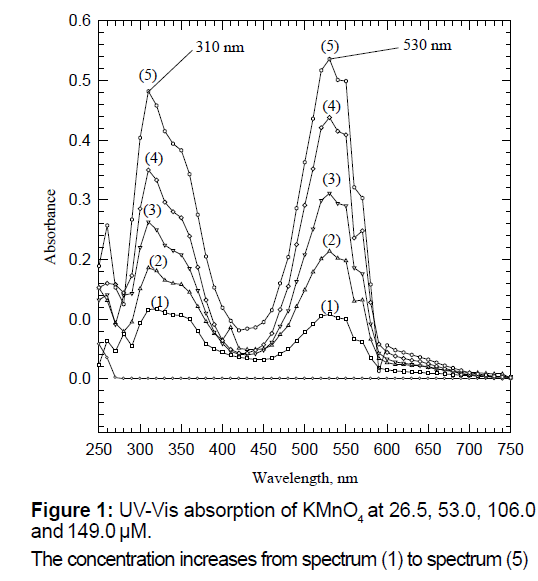
De-ionized water was used to prepare all solutions in this model. Various concentrations of aqueous Potassium Permanganate solutions (KMnO4 formula weight=158.03 g/mol) were prepared from reagent grade solid samples. Five solutions with the concentration of 26.5, 53.0, 79.5, 106.0 and 149.0 μM were prepared from a 6.613 × 10⁻³ M stock solution. A series of dilutions of 1, 2, 3, 4 and 5 milliliters (mL) of the stock solution was performed in a series of five different 250 mL volumetric flasks. The UV-Vis-experiments were conducted on these solutions. The resulting spectra are shown in Figure 1. All UV-Vis spectra were measured using the T60 high performance spectrophotometer purchased from Advanced ChemTech., Louisville, KY. The scans were collected from 250 nm to 750 nm. In previous years, the experiments were repeated using the less advanced Spectronic-20 (Milton Roy, Analytical Product Division) with comparable results. Reference cuvet for each individual sample was filled with de-ionized water.
Figure 1 is a representative graph of the absorption spectra of the visible region between 250 nm and 750 nm for aqueous potassium permanganate solutions in five different concentrations indicating the increase of the absorbance values with concentrations. This simple experiment can be used to convey to the students the basic analytical chemistry concepts of Beer’s Lambert law [10,11]. Equation (1) is the heart of spectroscopy which is known as the Beer’s law. The parameters involved in this equation are (A) the absorbance which is dimensionless parameter; the molar concentration which is represented by (c); the optical path length (b) (usually 1.0 cm) and the molar absorptivity (ε) which is the proportionality coefficient with the unit of M-1 cm-1.
A=ε bc(1)
This experiment will also answer a question such as why some solutions have their characteristic colors. Colored solutions absorb the complementary color and reveal the observed one. Potassium permanganate solution has such high deep purple/ violet color because it absorbs the green or the green-yellow color between 500-550 nm as shown in Figure 1.
This experiment will also convey the basic principle of inorganic bio-chemistry of ligand-to-metal charge transfer (LMCT) or electronic transitions found in standard inorganic chemistry laboratory book or inorganic textbooks [12-17]. The experiment will also open the discussion of oxidation state of the metal ion manganese, in that case. Undergraduate students at any level (biology or chemistry majors) should be able to recognize that manganese in potassium permanganate has the oxidation state of (+7) which has the configuration of d0. It should be clear that the color of potassium permanganate is not due to d→d electronic transitions, but instead it is due to LMCT. Most of the colors associated with the complexes of the first row transition metals are due to d→d electronic transitions [13-17].
Singh et al. in their inorganic chemistry laboratory book stated that “The American Chemical Society has recognized the problem of the lack of the student’s exposure to inorganic chemistry laboratory. The problem was due to high material costs, difficulties of the chemical waste disposal, toxicity fears, and the long and tedious procedures in preparing many inorganic materials” [12]. The hope here is to introduce an easy and affordable experimental procedure that can be incorporated in the inorganic chemistry or in the bio-inorganic laboratories (or the analytical chemistry class for that matter) in which students will think critically and formulate some questions, such as, what is the source of the intense color of the aqueous permanganate solutions that the most dilute of its solutions still shows a very intense absorption peak? The most diluted potassium permanganate solution has a low Molarity of 2.65 × 10⁻⁵ M or 26.5 μM.
By conducting this simple experimental model, educators should help students to comprehend the following principles: (1) Beer’s law (see supplementary material for linear regression), (2) rationale behind a solution’s color, (3) the LMCT principle learned in typical inorganic class, (4) the absence of the d→d electronic transition from some first row transition metals, (5) calculating oxidation states, and (6) conducting mathematical calculations involving conversion factor method.
2.2 Model 2
Visible absorption spectroscopy of chlorophyll
One of the main purposes of the current report is to compare the visible spectra of three totally different model systems using simple spectrophotometer and discussing the principles behind the appearance of various colors of organic and inorganic samples commonly used by undergraduates. Biology and Biochemistry text books that discuss photosynthesis state that “the intense colors of the chlorophylls and cartenoids make them ideal candidates for absorption spectroscopy studies” [19-22]. In the current experimental model, the summation absorption spectra of both chlorophyll a and b were measured. The high conjugation in the chlorophyll molecules is the reason behind the strong absorption of the radiation within the visible region. This is a drastic contrast to the reasons for the appearance of colors of the inorganic sample introduced in Model 1 above (see Model 3 for another contrasting model system).
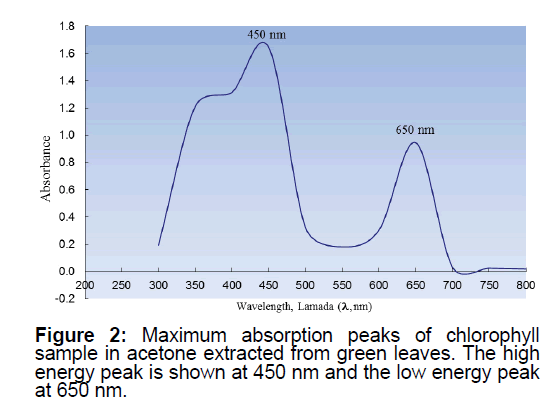
In this model, Chlorophyll was extracted following the procedures given in a typical modern experimental biochemistry book, macro- or micro scale organic experiment book [19,23]. Typically green leaves of different trees or shrubs were used (no particular preferences were given to the selection of the leaves, however using ivy and waxy leaves was avoided). Recommendations found in the literature were followed and the students were asked to bring their own leaf samples for analysis [19]. Figure 2 shows a representative sample of the UV-vies data collected.
2.3 Model 3
Hexa-aqua chromium nitrate and its visible absorption spectroscopy
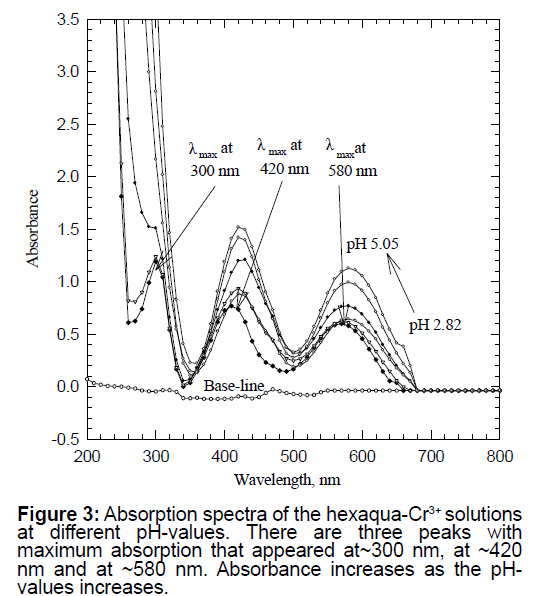
A solution of ~0.05 M hexa-aqua chromium (III) nitrate was prepared using reagent grade chromium nitrate nona-hydrate salt, formula weight=400.15 g/mol. This solution had a deep bluish color. The initial pH of this solution was found to be 2.82. An initial scan of this solution showed absorption spectra with three peaks at ~300 nm, at ~420 nm and at 580 nm. Figure 3 is the UV-vis spectra of ~0.05 M hexa-aqua chromium (III) nitrate solution. The pH-value was increased by adding the minimum amount of strong ~10 M NaOH solution. The results were clear to show that as the pH of the solution increased, the absorption of the three observed peaks increased also. By consulting Tanabe-Sugano diagrams for d3 metal ions (Cr3+ has a d3 configuration) and many standard inorganic textbooks, it was found that the three absorption peaks are due to both the d→d electronic transitions [13-18]. This is unlike the spectra presented in Model 1 of permanganate with d0 configuration. See the conclusion section for comparison of the two models.
3. Conclusion
In Model 1, a simple experimental set-up was introduced to collect the distinctive absorption peaks in the UV-Visible region of the spectrum (Two peaks have been observed with λmax=310 nm and 530 nm, respectively) of an inorganic sample (Figure 1). In Model 2, students were provided with the opportunity to isolate a biomolecule from a natural source, followed by its characterization using spectroscopy. Unlike potassium permanganate used in Model 1, chlorophyll a and b have two absorption maxima in the visible ranges of the spectrum of (660 nm to 675 nm) and (440 nm to 475 nm) (Figure 2). In Model 3, students collected the characteristic absorption spectra of the hexa-aqua chromium ion that possess three peaks at 300 nm, 420 nm and 580 nm (Figure 3).
From Figure 2, it appeared that the low energy absorption peak at the longer wavelength of 660 nm is always less intense than the high-energy peak at the shorter wavelength of 440 nm. This finding is in agreement with the literature values [19-23]. In contrast to chlorophyll a and b, which have two peaks with maximum absorptions, the plant pigment β-carotene exhibits intense absorption peak in just one region ~450 nm [19]. We did not isolate or observe β-carotene in the current paper. All the figures presented are the actual graphs collected by student during a typical laboratory course.
4. Acknowledgement
This work was supported in part by NSF under grant # HRD-1332459. We also would like to thank all of the students who participated in duplicating these data especially the Analytical Chemistry and Biochemistry classes. Also, thanks go to N. Bayakly, S. Painter and V. Savur of LeMoyne-Owen College for reading the manuscript. Special thanks go to Prof. Tom Goodwin of the chemistry department at Hendrix College, Conway, AR for guidance in conducting undergraduate research over the decades.
References
- Emma MD. (1935). Chlorophyll and hemoglobin-two natural pyrrole pigments. J Chem Educ. 12: 208-216.
- Harold H, Sherma J. (1967). Tswett: Adsorption analysis and chromatographic methods: Application to the chemistry of chlorophylls, Strains. J Chem Educ. 44: 238-242.
- Hardcastle JE. (1972). The chlorophyll Cat. J Chem Educ. 49: 364-364.
- Dujardin, Esther, Laszlo, et al. (1975). The chlorophylls. An experiment in bioinorganic chemistry. J Chem Educ. 52: 742-744.
- Silveira A, Koehler JA, Beadel EF, Monroe PA. (1984). HPLC analysis of chlorophyll a, chlorophyll b and beta-carotene in collard greens. A J Chem Educ. 61: 264-265.
- Susan MDJ. (1984). Chlorophyll separation and spectral identification (F&R). J Chem Educ. 61: 454-456.
- Schaber PM. (1985). Normal-phase open column versus reversed-phase high performance liquid chromatography: Separation of chlorophyll a and chlorophyll b from their diastereomers. J Chem Educ. 62: 1110-1113.
- Wickliff JL, Wickliff D. (1991). Instrumentation for measuring in vivo chlorophyll fluorescence induction. E J Chem Educ 68: 963-965.
- Quach HT, Steeper RL, Griffin GW. (2004). An improved method for the extraction and thin-layer chromatography of chlorophyll a and b from spinach. J Chem Educ. 81: 385-387.
- Skoog DA, West DM, Holler FJ, et al. (2004). Fundamentals of analytical chemistry, 8th Edn. Brooks-Cole-Thomson, Belmont, CA.
- Harris DC. (2007). Quantitative chemical analysis, 7th Edition, W. H. Freeman and company, New York.
- Szafran Z, Pike RM, Singh MM. (1991). Microscale inorganic chemistry: A comprehensive laboratory experience, John Willy and Sons, Inc., New York.
- Huheey J, Keiter E, Keiter R. (1993). Inorganic Chemistry Principals of Structure and Reactivity, 4th Edn. Harper Collins College Publishers, 10 East 53rd street, New York, USA.
- Douglas B, MacDaneil D, Alexander J. (1994). Concepts and Models of Inorganic Chemistry, 3rd Ed. John Wiley & Sons Inc.: New York, USA.
- Shriver D, Atkins P. (1999). Inorganic Chemistry, 3rd Edn. W. H. Freeman and Company: New York, USA.
- Housecroft CE, Sharpe AG. (2005). Inorganic chemistry, second edition, Pearson Education Limited, Edinburgh Gate, Essex, England.
- Canham GR, Overton T. (2003). Descriptive inorganic chemistry third edition, W. H. Freeman and company, 41 Madison Ave, New York, USA.
- Tan B, Soderstrom D. (1989). Qualitative aspects of UV-VIS spectroscopy of ÃÆÃâÃâà ¸ÃÆâÃâââ¬Ãâââ¬Åcarotene and lycopene. J Chem Educ. 66. 258-260.
- Boyer R. (2000). Modern experimental biochemistry, 3rd edition, Benjamin/Cummings, and imprint of Addison Wesley Longman 1301 Sansome Street, San Francisco, CA , USA.
- Voet D, Voet J, Pratt C. (1999). Fundamentals of biochemistry, John Wiley & Sons, New York, USA.
- Garrett RH, Grisham CM. (2005). Biochemistry, Instructor third edition Thomson, Brooks/Cole, Belmont, CA.
- Lehninger AL. (2000). Principles of Biochemistry, third edition by Nelson, D. L. and Cox, M. M. WORTH, New York, NY, USA.
- Williamson KL. (1999). Macroscale and microscale organic experiments, third edition, Houghton Mifflin, 222 Berkeley Street, Boston, MA, USA.

Open Access Journals
- Aquaculture & Veterinary Science
- Chemistry & Chemical Sciences
- Clinical Sciences
- Engineering
- General Science
- Genetics & Molecular Biology
- Health Care & Nursing
- Immunology & Microbiology
- Materials Science
- Mathematics & Physics
- Medical Sciences
- Neurology & Psychiatry
- Oncology & Cancer Science
- Pharmaceutical Sciences


