The Physiological Response of Cells in Type 1 and Type 2 Diabetes Mellitus.
Ayman Saber Mohamed, Amel Mahmoud Soliman, Mohamed Assem Said Marie
Ayman Saber Mohamed1, Prof. Dr. Amel Mahmoud Soliman2*, Prof. Dr. Mohamed Assem Said Marie3
1Assistant lecturer of Physiology, Zoology Department - Faculty of Science - Cairo University, 12613, Giza, Egypt
2Professor of Physiology, Zoology Department, Faculty of Science, Cairo University, Egypt
3Professor of Environmental Physiology, Zoology Department - Faculty of Science - Cairo University
Received Date: August 25, 2016; Accepted Date: September 21, 2016; Published Date: September 28, 2016
Abstract
Background: Diabetes mellitus is global metabolic disease that increases continuously. It is usually divided into two main categories; type 1 and type 2 diabetes mellitus.
Aim: The aim of study to evaluate the physiological response of cells in STZ and STZ/HFD animal models for both types of diabetes.
Main methods: Twenty-four male Wistar rats were divided into 4 groups (6 rats /group): control for T1DM, diabetic type 1, control for T2DM and diabetic type 2. The diseases induced by single dose of streptozotocin (60 mg/kg, i.p) T1DM and HFD for 4 weeks previously the injection with streptozotocin (30 mg/kg, i.p) for T2DM.
Results: Type 1 diabetic group groups showed higher defect in the body weight, hotplate period, insulin, AST, ALT, MDA and GSH, while type 2 diabetic group showed higher defect in G6PD and GGT.
Conclusion: The two models of diabetes revealed that the cells in T1DM prefer to use glycolysis pathway, while the cells in T2DM prefer pentose pathway, which might be relevant in the real human diabetes mellitus.
Keywords
Diabetes mellitus; Streptozotocin; Obesity; Insulin resistance
Abbreviations
STZ: Streptozotocin; HFD: High Fat Diet; DM: Diabetes Mellitus; T1DM: Type 1 Diabetes Mellitus; T2DM: Type 2 Diabetes Mellitus; ROS: Reactive Oxygen Species; G6PD: Glucose- 6-Phosphate Dehydrogenase; AST: Aspartate Aminotransferase; ALT: Alanine Aminotransferase; GGT: γ-Glutamyltransferase; MDA: Malondialdehyde; GSH: Glutathione Reduced.
1. Introduction
Diabetes mellitus (DM) is the most public chronic metabolic disease identified in children and adult [1]. Many studies reveal an increasing trend in diabetes prevalence globally, with the highest growth dynamics in the youngest age [2]. DM is a metabolic disease resulting from a defect in insulin [3]. It may be categorized into numerous types but the two main types are type 1 and type 2 [4].
Type 1 Diabetes Mellitus (T1DM) is related to autoimmune process of destruction of pancreatic beta cells leading to absolute insulin deficiency and organ damage [1]. T2DM is a common health problem affecting about 8.3% of the world population, which would increase in the next 20 years [5]. Insulin resistance as result of insulin insensitivity which characterizes it [6]. The β cells normally compensate insulin resistance through more insulin production to keep the glucose near the normal level [7]. Reduced sensitivity to insulin in liver, muscle, and fatty tissue lead to impaired insulin secretion and eventual pancreatic beta-cell failure [6,8].
Streptozotocin (STZ) is a usually used for the induction of experimental diabetes model in animals [9]. The toxic mechanism of STZ is mediated by reactive oxygen species (ROS) [10]. Only one dose of STZ can induce T1DM in rats [11], while T2DM can be induced by STZ injection after High Fat Diet (HFD) feeding [12]. In the model of HFD/STZ, the state of obesity, insulin resistance and/or glucose intolerance is simulated by a period of a HFD [13]. The aim of study to evaluate the pathophysiological response of cells in STZ and STZ/HFD models of type 1 and type 2 diabetes mellitus.
2. Materials and Methods
2.1 Chemicals and reagents
Insulin kits and Streptozotocin were obtained from Sigma-Aldrich (St. Louis, MO, USA).γ- Glutamyltransferase (GGT) kit was purchased from Spectrum Diagnostics company (Obour City, EGY), while the other kits were obtained from the Biodiagnostic company (El Moror St, Dokki, EGY).
2.2 Experimental animals
Male albino Wistar rats (140 ± 10 G) were used in this study. The rats were got from the National Research Center (Egypt, Giza). They were accommodated in a temperature and humidity controlled environment and given food and water ad libitum for 1 week before the experiment.
2.3 Ethical consideration
Experimental protocols were approved by Institutional Animal Care and Use Committee (IACUC) (Egypt) (CUFS/F/33/14). All procedures were carried out according to international guidelines for the care and use of laboratory animals.
2.4 Induction of type 1 diabetes mellitus (T1DM)
The rats were starving for twelve hours, but were allowable to access to water. The disease was achieved by injection of STZ (60 mg/kg; i.p) dissolved in sodium citrate buffer (0.1 mol/L at pH 4.5). Concentration of fasting blood glucose was measured three days after injection of STZ. If the concentration of fasting blood glucose more than 300 mg/100 ml, the rats were considered diabetic [14].
2.5 Induction of type 2 diabetes mellitus (T2DM)
High fat diet (60% calories from fat, 35% from protein and 5% from carbohydrate) were fed to rats for 4 weeks [15]. Then the rats were starving for twelve hours, but were allowable to access to water. The disease was achieved by injection of STZ (30 mg/kg; i.p) dissolved in sodium citrate buffer (0.1 mol/L at pH 4.5). Concentration of fasting blood glucose was measured three days after injection of STZ. If the concentration of fasting blood glucose more than 300 mg/100ml, the rats were considered diabetic [16].
2.6 Experimental design
Twenty-four rats were divided into four groups (6 rats/group):
Control group of T1DM: the rats injected by citrate buffer (0.1mol/l, i.p).
T1DM: the rats injected by STZ (60 mg/kg, i.p),
Control group of T2DM: After 4 weeks of normal diets feeding, the rats injected by citrate buffer (0.1mol/l, i.p).
T2DM: After 4 weeks of HFD feeding, the rats injected by STZ (30 mg/kg, i.p).
2.7 Determination of the physical parameters
Body weight
Weights of rats were measured at the start and the ending of the experiments.
Hot plate test
The hot plate period was measured according Eddy and Leimbach [17].
Wire suspension
The Wire suspension period was measured according [18].
2.8 Animal handling and specimen collection
At the end of experiment, the rats were fully anesthetized with 3% sodium pentobarbital, and the blood collected by cardiac puncture.
The serum was separated by centrifugation (3000 rpm, 15 min) and stored at -80ºC for the biochemical assessment. Liver and kidney were isolated and stored at -80ºC for biochemical measurements.
2.9 Liver and kidney homogenate preparation
Liver and kidney tissues were homogenized (10% w/v) in ice-cold 0.1 M Tris-HCl buffers (pH 7.4). The homogenate was centrifuged at 860 rpm for 15 min. at 4ºC and the resultant supernatant was used for the biochemical analyses.
2.10 Biochemical analyses
The serum glucose was assessed by the method of Freund et al, insulin, alanine aminotransferase (ALT), Aspartate Aminotransferase (AST) and γ-Glutamyltransferase (GGT) were assessed using suitable kits [19-22].
Tissue Malondialdehyde (MDA) was estimated by Ohkawa et al. glutathione reduced (GSH) and liver glucose-6-phosphate dehydrogenase (G6PD) were determined in the tissue homogenate supernatant using suitable kits [23-25].
2.11 Statistical analysis
Values were represented as means ± SE. The comparisons within groups were evaluated utilizing paired t–test and p<0.05 was considered statistically significant. SPSS, for Windows (version 15.0) was used for the statistical analysis. Percentage of change used to compare between T1DM and T2DM and calculated by the following equation:

3. Results
3.1 Physical parameters
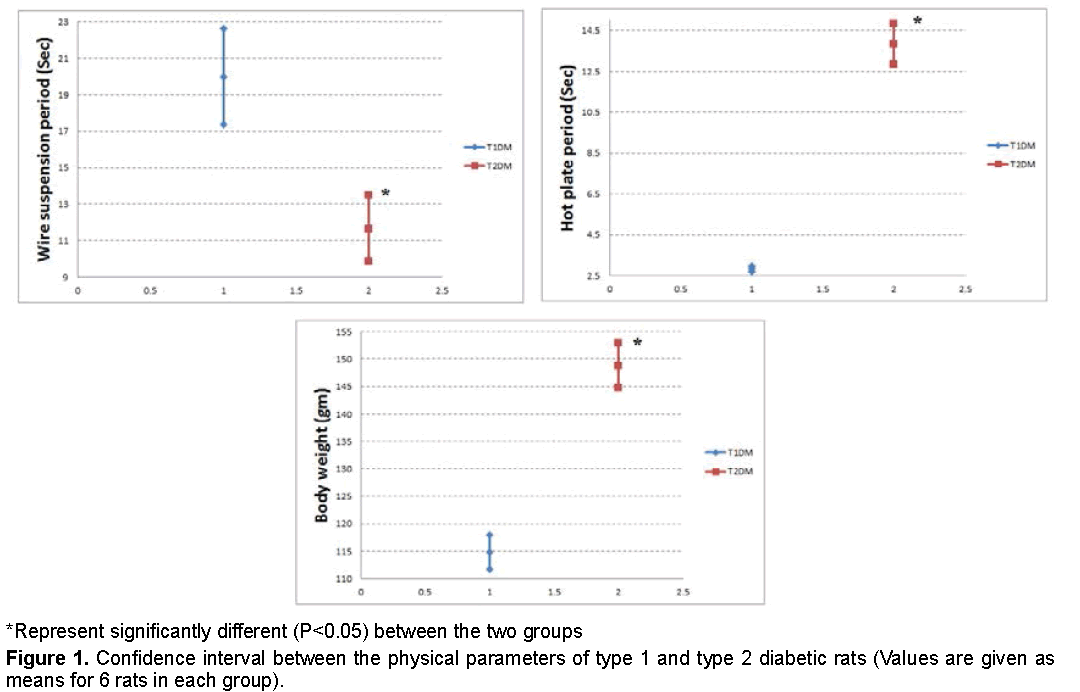
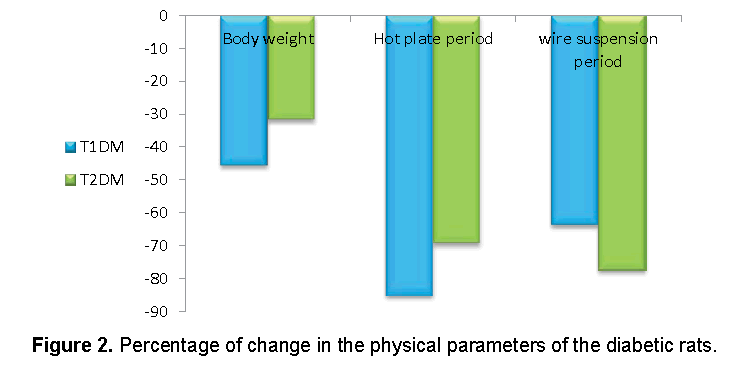
Data recorded in Figures 1 and 2 demonstrated that, the reduction in body weight and hot plate period was higher in T1DM, while the reduction in suspension period was higher in T2DM.
3.2 Diabetic markers
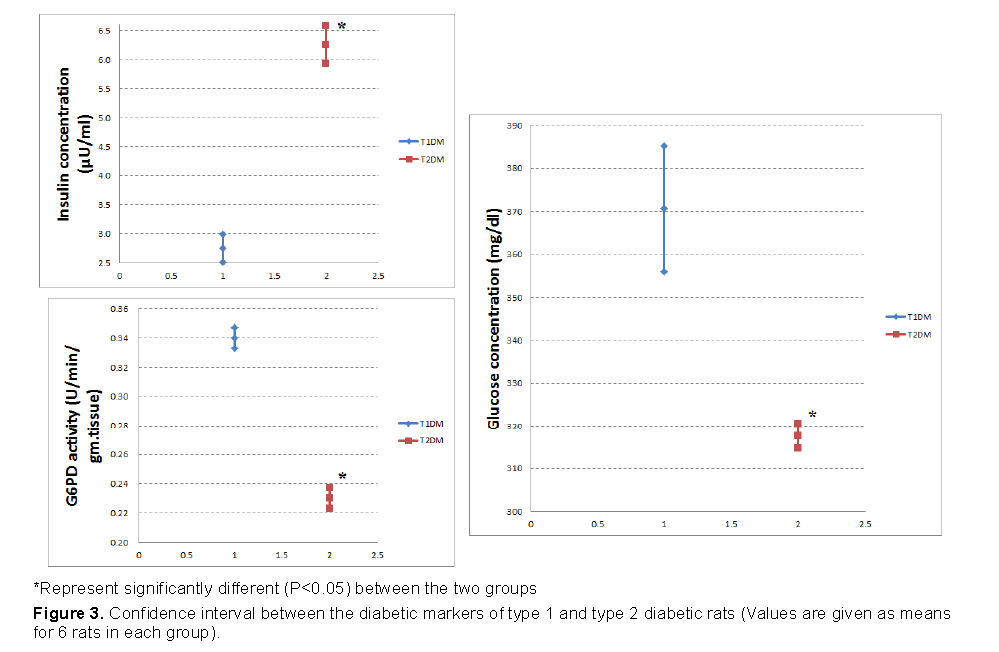
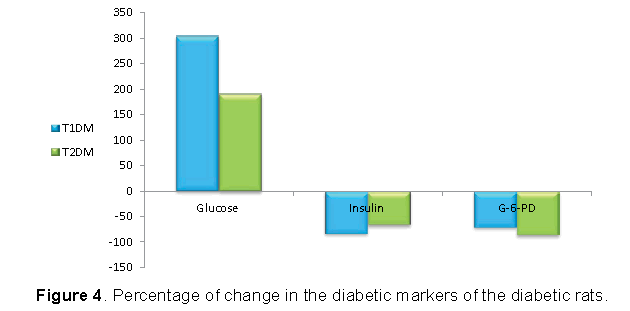
Figures 3 and 4 demonstrated that, the increase in glucose was higher in T1DM and the reduction in insulin was higher in T1DM. However, the reduction in G6PD was higher in T2DM.
3.3 Liver function parameters
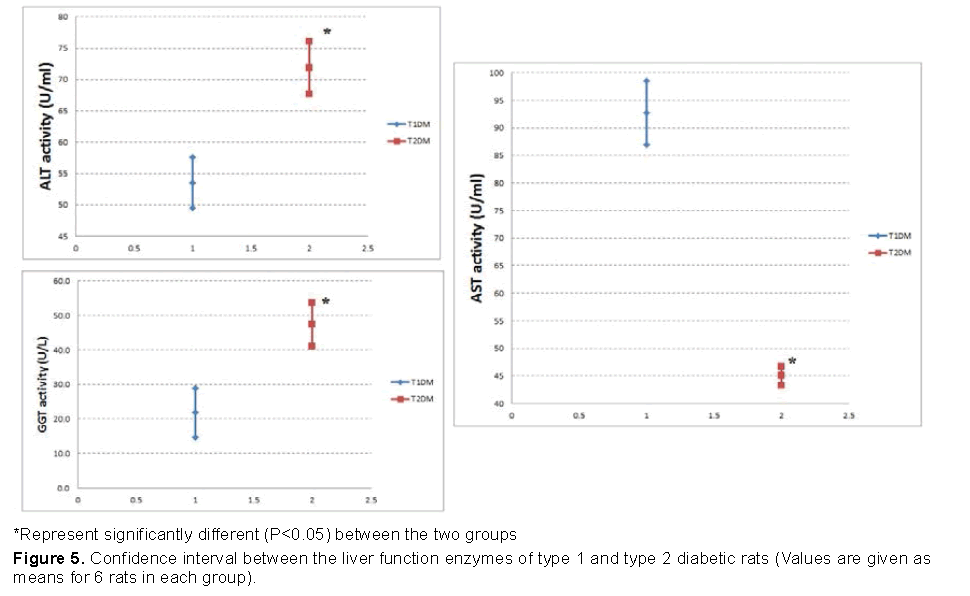
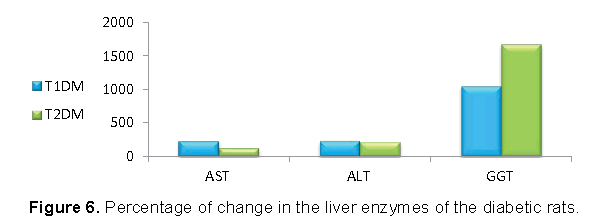
Our data shown in Figures 5 and 6 represented that, the increase in AST and ALT was higher in T1DM, while the increase in GGT was higher in T2DM.
3.4 Oxidative stress markers
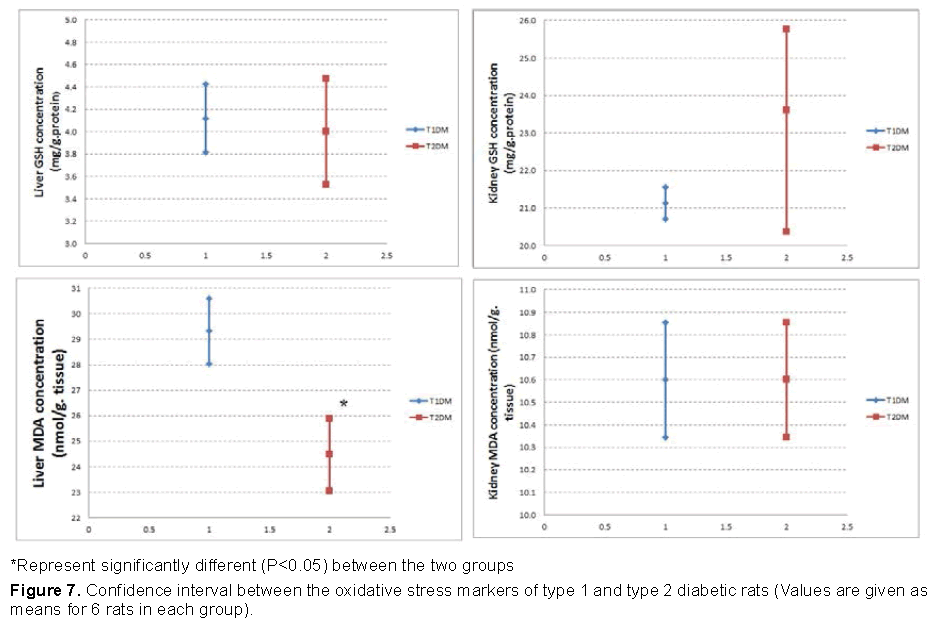
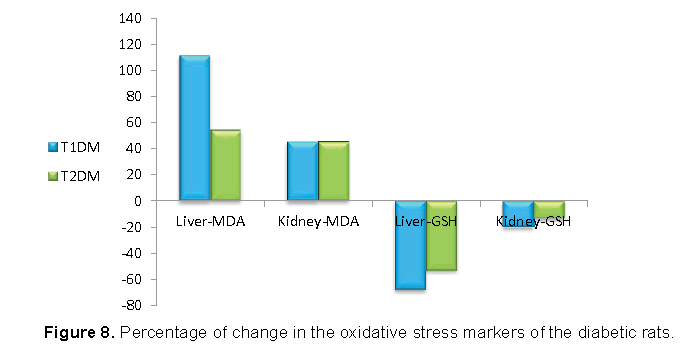
Our data shown in Figures 7 and 8 represented that, the increase in MDA was higher in T1DM, and the decrease in GSH was higher in T1DM than T2DM .
4. Discussion
Diabetes Mellitus (DM) is global metabolic disease that increases continuously [26]. It is usually divided into two main categories; type 1 and type 2 diabetes mellitus. Type 1 Diabetes Mellitus (T1DM) is one genetic disorders caused by autoimmune destruction of β-cells leading to insulin deficiency [27]. On the other hand, Type 2 Diabetes Mellitus (T2DM) is metabolic disease resulting from defects insulin secretion and function [28].
Our results indicated that, the final body weights were decreased in T1DM more than T2DM. As insulin considered being an anabolic hormone, its effects serve to encourage the synthesis of carbohydrate, fat and protein [29]. Therefore, the high defect in insulin in T1DM directly effect on the body weight.
Neuropathy and myopathy may occur in spontaneous and experimental diabetes mellitus [30]. The current study showed that the sensitivity to pain increased in the diabetic rats. A hyperglycemic state induces high production of intracellular sorbitol in tissues [31]. Sorbitol over production elevates an intracellular osmotic pressure causing increased Ca2+ influx and membrane depolarization [32]. Increase an osmotic pressure and Ca2+ influx lead to increase pain sensitivity. T1DM showed higher sensitivity to pain than T2DM, which may be related the high glucose level in type 1 diabetic rats.
The hanging wire test is performed in order to demonstrate a motor neuromuscular impairment and motor coordination [33]. Muscle strength and the prehensile reflex of the diabetic rats were decreased as shown from wire suspension latencies in the present study. STZ negatively affected myoblast proliferative capacities, which result of a G2/M phase cell cycle arrest that was associated with an increase in Reactive Oxygen Species (ROS) production [34].
The present investigation showed that, serum glucose concentration increased, while serum insulin decreased in T1DM more than T2DM. In β-cells, STZ impairs glucose oxidation, decreases insulin production and secretion, and disrupts glucose transport and glucokinase activity [10,35,36]. Therefore, as the dose of STZ was higher in T1DM, the defect in glucose and insulin were higher in T1DM.
Glucose-6-Phosphate Dehydrogenase (G6PD) is enzyme catalyzes the conversion of glucose-6- phosphate to 6-phosphogluconate with the generation of NADPH. The decrease in G6PD activity within the diabetic male rats in the present study may be due to the insufficiency of insulin [37]. As the reduction in insulin was more in T1DM than T2DM, the reduction in G6PD must be higher in T1DM. However, our results showed that the reduction in T2DM was higher than T1DM. This result will be explained with G6PD, GGT and GSH system.
Data from the current study showed an increase in the serum AST and ALT activities of the diabetic rats. Increased activities of these enzymes may be due to deficiency of insulin [38]. Therefore, the increase in AST and AlT was higher in T1DM.
Many experimental and clinical studies suggest that oxidative stress plays significant role in development of diabetes mellitus [39]. The main mechanism of STZ action is mediated by reactive oxygen species (ROS) [10]. STZ enters the pancreatic beta cell through the GLUT-2 transporter causing alkylation of the DNA [40]. In addition, STZ was found to generate ROS and evoke other deleterious changes in the cells [41]. The formation of superoxide anions results from both STZ action on mitochondria and increased activity of xanthine oxidase [40]. It was demonstrated that STZ inhibits the Krebs cycle and substantially decreases oxygen consumption by mitochondria [42,43]. The measurement of Malondialdehyde (MDA) is generally used as marker of lipid peroxidation [44]. As increase MDA level result of oxidative stress condition due to STZ injection, the increase in MDA was higher in T1DM. Glutathion Reduced (GSH) is nonprotein antioxidant substance [45,46]. It is a major endogenous antioxidant, which counterbalances free radical mediated damage [47]. The decrease in the concentration of GSH in might be due to NADPH depletion or GSH consumption in the removal of peroxide [48].
The main abnormal results in our study were in G6PD and Gamma Glutamyl Transferase (GGT). The decrease in liver G6PD must be higher T1DM than T1DM due to the high reduction in insulin in T1DM. For the same reason the increase in serum GGT must be higher in T1DM than T2DM. On other way, the decrease in liver GGT must be higher in T1DM than T2DM
Our results showed that, the decrease in liver G6PD and GGT was higher in T2DM than T2DM. G6PD is an important site of control pentose phosphate pathway, which provides NADPH for lipogenesis and production of GSH [49]. GGT a microsomal enzyme that present in the membrane of the endoplasmic reticulum of the hepatocyte [50]. GGT has a pivotal role in the maintenance of intracellular antioxidant defenses through its mediation of extracellular GSH transport into most types of cells [50]. Therapy, consume G6PD and GGT means that the cells in T2DM tend to used pentose pathway to support the antioxidant system by GSH where they can use the fat for production of energy. Conversely, the cells in T1DM tend to pathway of glycolysis to compensate the drop in energy. Finally, further molecular study needed to support these differences between the two models.
5. Conclusion
The two models of diabetes revealed that the cellular response to the hyperglycemic condition different according to type of diabetes induced by STZ. In type 1 diabetes, due to the sever deficiency in energy the cells tend to use glycolysis pathway, while, in type 2 diabetes the cells tend to use pentose pathway to maintain an antioxidant system. The results may supporting using of antioxidant drug with insulin in treatment type 1 diabetes where the cells uses almost all glucose in production of energy rather than supporting the antioxidant system.
References
- KrzewskaA, BenSkowronekI. (2016). Effect of associated autoimmune diseases on type 1 diabetes mellitus incidence and metabolic control in children and adolescents. Biomed Res Int.6219730.
- SolteszG, Patterson CC, Dahlquist G. (2007). Worldwide childhood type 1 diabetes incidence—what can we learn from epidemiology? Pediatric Diabetes.8:6–14.
- Beverley B, Eschwège E. (2003). The diagnosis and classification of diabetes and impaired glucose tolerance. In John CP and Gareth, W Eds, Textbook of Diabetes.
- WHO. (1999). Definition, diagnosis and classification of diabetes mellitus and its complications, Part 1: diagnosis and classification of diabetes mellitus. Report of a WHO Consultation. Geneva: World Health Organization.
- Whiting DR, Guariguata L, Weil C. (2011). Diabetes atlas: Global estimates of the prevalence of diabetes for 2011 and 2030. Diabetes Res ClinPract.94:311 – 321.
- Robertson RP.(1995). Antagonist: diabetes and insulin resistance–philosophy, science and the multiplier hypothesis. J Lab Clin Med.125: 560-564.
- Riguera R. (1997). Isolating bioactive compounds from marine organisms. J Mar Biotechnol. 5:187-193.
- Cornell S.(2015). Continual evolution of type 2 diabetes: An update on pathophysiology and emerging treatment options. Clin Risk Manag.16: 621-632.
- Lenzen S.(2008). The mechanisms of alloxan- and streptozotocin-induced diabetes. Diabetologia.51: 216–226.
- Szkudelski T. (2001). The mechanism of alloxan and streptozotocin action in B cells of the rat pancreas. Physiol Res.50:537-546.
- Yin D, Tao J, Lee DD, et al. (2006). Recovery of islet beta-cell function in streptozotocin-induced diabetic mice: An indirect role for the spleen. Diabetes.55: 3256–3263.
- Skovso S. (2014). Modeling type 2 diabetes in rats using high fat diet and streptozotocin. J Diabetes Investig.5: 349–358.
- Chen X, Fu X, Li C, et al.(2014). ER stress and ER stress-induced apoptosis are activated in gastric SMCs in diabetic rats. World J Gastroenterol.20: 8260-8267.
- Reed MJ, Meszaros K, Entes LJ, et al.(2000).new rat model of type 2 diabetes: The fat-fed, streptozotocin-treated rat. Metabolism.49:390–1394.
- Ebaid H.(2014). Promotion of immune and glycaemic functions in streptozotocin-induced diabetic rats treated with un-denatured camel milk whey proteins. NutrMetabol.11: 1-31.
- Eddy NB,Leimbach D. (1953). Synthetic analgesics 11. Diathianylbutenyl and Dithienylbutylamines. JPharmac. 107:385-393.
- Troen AM, Chao WH, Crivello NA, et al.(2008). Cognitive impairment in folate-deficient rats corresponds to depleted brain phosphatidylcholine and is prevented by dietary methionine without lowering plasma homocysteine. JNutr.138:2502–2509.
- Freund A, Johnson SB, Rosenbloom A, et al.(1986). Subjective symptoms, blood glucose estimation and blood glucose concentrations in adolescents with diabetes. Diabetes Care.9: 236–243.
- Herbert V, Lau K, Gottlieb CW, et al.(1965). Coated charcoal immunoassay of insulin. J ClinEndocrinol. 25: 1375.
- Reitman SS, Frankel AA. (1957).Colorimetric method for the determination of serum glutamic oxalacetic and glutamic pyruvic transaminases. Am J ClinlPathol.28:56-63.
- Szasz G. (1974). Determination of GGT activity. Meth Enzym Anal.2:715-720.
- Ohkawa H, Ohishi N, Yagi K. (1979). Assay for lipid peroxides in animal tissues by thiobarbituric acid reaction. AnalBiochem.95:351-358.
- Beutler E, Duron O, Kelly MB.(1963). Improved method for the determination of blood glutathione. J Lab Clin Med.61:882–888.
- Kornberg A,Horecker BL. (1955). Glucose-6-Phosphate Dehydrogenase. Methods Enzymol.1: 323-329.
- Piero MN, Nzaro GM, Njagi JM. (2014). Diabetes mellitus – a devastating metabolic disorder. Asian JBiomed Pharmaceut Sci.4:1-7.
- Noble JA, Valdes AM. (2011). Genetics of the HLA region in the prediction of type 1 diabetes. Current Diabetes Reports.11:533.
- Chen Y, Wang X, Shao X. (2015). A combination of human embryonic stem cell-derived pancreatic endoderm transplant with LDHA-repressing miRNAcan attenuate high-fat diet induced type II diabetes in mice. J Diabetes Res. 796912.
- Dimitriadisa G, Mitroub P, Lambadiaria V, et al. (2011). S A. Insulin effects in muscle and adipose tissue. Diabetes ResClinPract.9:52-59.
- Clements RS. (1979). Diabetic neuropathy-New concepts of its etiology. Diabetes.28:604- 611.
- Malone JI, Lowitts S. (1992). Measurement of tissue sorbitol in diabetes mellitus: Enzyme method versus gas liquid chromatography.Metabol.41: 224-227.
- Viana F, Pera EDL, Schmidt RF, et al. (2001). Swelling activated calcium signaling in cultured mouse primary sensory neurons. EurJ Neurosci.13:722-734.
- CrestaniF, Löw K, Keist R. (2001). Molecular targets for the myorelaxant action of diazepam. MolPharmacol. 59:442-445.
- Adam PW, Johnston JE, Campbell JG, et al. (2001). Streptozotocin induces G2 arrest in skeletal muscle myoblasts and impairs muscle growth in vivo. Am J PhysioCell Physiol.292:1033-1040.
- Bedoya FJ, Solano F, Lucas M. (1996). N-monomethyl-arginine and nicotinamide prevent streptozotocin-induced double strand DNA break formation in pancreatic rat islets. Experientia. 52:344-347.
- Islam MS, Wilson RD. (2012). Experimentally induced rodent models of type 2 diabetes. In Joost, H-G et al., eds., Animal Models in Diabetes Research. Humana Press, New York.
- Ahmed D, Kumar V, Verm A, et al. (2014).Antidiabetic,renal/hepatic/pancreas/cardiac protective and antioxidant potential of methanol/dichloromethane extract of AlbizzialebbeckBenth. stem bark (ALEx) on streptozotocin induced diabetic rats. BMC Complement Altern Med.14: 214-243.
- Mori DM, Baviera AM, De Oliveira Ramalho LT, et al. (2003). Temporal response pattern of biochemical analytes in experimental diabetes. BiotechnolApplBiochem.38:183-191.
- Maritim AC, Sanders RA, Watkins JB. (2003). Diabetes, oxidative stress and antioxidants: A review. JBiochemMolToxicol.17:24-38.
- Szkudelski. (2001). The mechanism of alloxan and streptozotocin action in B cells of the rat pancreas. Physiol Res.20: 537–546.
- Bedoya FJ, SolanoF, Lucas M. (1996). N-monomethyl-arginine and nicotinamide prevent streptozotocin-induced. Experientia.52: 344-347.
- Turk J, Corbett JA, Ramanadham S, et al. (1993). Biochemical evidence for nitric oxide formation from streptozotocin in isolated pancreatic islets. BiochemBiophys Res Commun.197:1458-1464.
- NukatsukaM, Yoshimura Y, Nishida M, et al. (1990).Allopurinol protects pancreatic beta cells from the. J Pharmacobiodyn.13:259-262.
- Karadeniz G, AcikgozS, Tekin IO, et al. (2008). Oxidized low-density-lipoprotein accumulation is associated with liver fibrosis in experimental cholestasis. Clinics.46: 531-540.
- Raza H, John A. (2012).Streptozotocin-induced cytotoxicity, oxidative stress and mitochondrial dysfunction in human hepatoma hepG2 cells. Int J Mol Sci.13: 5751–5767.
- Mazumder UK, Gupta M, Rajeshwar Y. (2005).Antihyperglycemic effect and antioxidant potential of Phyllanthusniruri (Euphorbiaceae) in streptozotocin induced diabetic rats. Eur Bull Drug Res. 13: 1-9.
- Gumieniczek A. (2005). Effects of repaglinide on oxidative stress in tissues of diabetic rabbits. DiabetesResClin. Pract.68:89-95.
- Anuff M, Omoruyi FO, Morrison EYS, et al. (2005). Changes in some liver enzymes in streptozotocin-induced diabetic rats fed sapogenin extract from bitter yam (Dioscoreapolygonoides) or commercial diosgenin. West Indian Med J. 54: 97-101.
- Khalaf AAA, Mekawy FM, Moawad SM, et al. (2009). Comparative study on the protective effect of some antioxidants against CCl4 hepatotoxicity in rats. Egypt. J Nat Toxins. 6:59-82.
- Kugelman A, Choy HA, Liu R, et al. (1994). Gamma-glutamyltranspeptidase is increased by oxidative stress in rat alveolar L2 epithelial cells. Am J RespirCell Mol Biol.11:586–592.
- Guilherme A, Virbasius JV, Puri V, et al. (2008). Adipocyte dysfunctions linking obesity to insulin resistance and type 2 diabetes. Nat Rev Mol Cell Biol.9: 367-377.

Open Access Journals
- Aquaculture & Veterinary Science
- Chemistry & Chemical Sciences
- Clinical Sciences
- Engineering
- General Science
- Genetics & Molecular Biology
- Health Care & Nursing
- Immunology & Microbiology
- Materials Science
- Mathematics & Physics
- Medical Sciences
- Neurology & Psychiatry
- Oncology & Cancer Science
- Pharmaceutical Sciences
