The Objective of this Study is to Assess the Carbon Emission Measurement and Emission Reduction Potential of Assembled Buildings under a Multi-Scenario Perspective
Yinkai Wei1*, Wei Li1, Wudong Ban1, Qi Zhang2 and Zhong Diao Xie3
1Department of Molecular Biology, Shanxi Conservancy Vocational and Technical College, Yuncheng, Shanxi, China 2Department of Molecular Biology, Yuncheng Vocational and Technical University, Yuncheng, Shanxi, China 3Department of Molecular Biology, Jiangxi University of Science and Technology, Ganzhou, Jiangxi, China
Published Date: 2025-07-24Yinkai Wei1*, Wei Li1, Wudong Ban1, Qi Zhang2 and Zhong Diao Xie3
1 Department of Molecular Biology, Shanxi Conservancy Vocational and Technical College, Yuncheng, Shanxi, China
2 Department of Molecular Biology, Yuncheng Vocational and Technical University, Yuncheng, Shanxi, China
3 Department of Molecular Biology, Jiangxi University of Science and Technology, Ganzhou, Jiangxi, China
- *Corresponding Author:
- Yinkai Wei
Department of Molecular Biology, Shanxi Conservancy Vocational and Technical College, Yuncheng, Shanxi, China
E-mail: 18579715060@163.com
Received date: December 16, 2024, Manuscript No. IPEJBIO-24-20157; Editor assigned date: December 19, 2024, PreQC No. IPEJBIO-24-20157 (PQ); Reviewed date: January 03, 2025, QC No. IPEJBIO-24-20157; Revised date: July 17, 2025, Manuscript No. IPEJBIO-24-20157 (R); Published date: July 24, 2025, DOI: 10.36648/1860-3122.21.2.111
Citation: Wei Y, Li W, Ban W, Zhang Q, Xie ZD (2025) The Objective of this Study is to Assess the Carbon Emission Measurement and Emission Reduction Potential of Assembled Buildings under a Multi-Scenario Perspective. Electronic J Biol 21(2): 1-11
Abstract
The construction industry is regarded as a key field for energy conservation and emission reduction. Consequently, a detailed investigation of the potential for emission reduction in China's assembly buildings and the anticipated trajectory of their development is of significant practical importance for the future of the country. In light of the aforementioned background, a carbon emission dynamic model has been constructed, comprising six scenarios designed to simulate and evaluate the carbon emissions of China's assembly buildings, thereby exploring their potential for emission reduction. It is anticipated that China's assembly building market share will reach 40.8% by 2035, which is of significant relevance to the future development of the country. It is anticipated that the complete replacement of the traditional building model with an assembled building will result in a reduction of carbon emissions by up to 12,929,700 tons by 2035. The data not only demonstrates the significant potential of assembled buildings in terms of energy saving and emission reduction, but also indicates the trajectory of future development within the construction industry.
Keywords
Carbon emission reduction; System dynamics; Scenario forecasting; Emission reduction potentials
Introduction
The Central Committee of the Communist Party of China (CPC) has put forth a "dual-carbon" strategy to address environmental challenges and advance sustainable development. The construction industry's carbon neutrality is contingent upon the prevalence of assembled buildings, which offer substantial environmental benefits [1]. Since their promotion by the state in 2016, assembled buildings
have witnessed a period of accelerated development. Since its promotion by the state in 2016, assembly building has developed rapidly and received substantial policy support [2-5]. China has set a target of completing the industrialisation of construction by 2035, and the scale of assembly construction continues to expand, accounting for 24.5% of new construction in 2021, indicating a positive trajectory. However, the construction boom has also brought pressure on the ecological environment [6]. The prosperity of the construction industry exerts pressure on the ecological environment, and China, as a major energy consumer, exhibits a high carbon emission intensity. It is therefore imperative that the construction industry undergoes a green and low-carbon development process. The construction of assembled buildings has become a pivotal element in the processes of industrial transformation and upgrading, as well as sustainable development, due to their inherent characteristics which facilitate energy savings and reductions in emissions. The gradual replacement of traditional buildings can contribute to the reduction of environmental pressure and facilitate the harmonious coexistence of architecture and ecology [7]. The building industry is in urgent need of green and low-carbon development.
It is therefore of great strategic importance to conduct a comprehensive study of the carbon emission measurement and reduction potential of assembled buildings, and to investigate the most effective carbon reduction path in order to achieve the national emission reduction target. This will not only enable an accurate assessment of its role in energy conservation and emission reduction, but also provide a scientific basis for the formulation of policies and the development of the industry.
The research on the measurement and reduction potential of carbon emissions from assembled buildings is focused on three key areas: the methods used to measure these emissions, the technologies that can be employed to reduce them, and the potential for their use in practice.
Carbon emission measurement: The researchers constructed a refined model to predict national and provincial carbon emission trends, taking into account multiple factors such as energy use, industrial production, and transportation. The Life Cycle Assessment (LCA) method is employed to conduct a comprehensive analysis of the environmental impact of assembled buildings. Models such as STIRPAT, IPAT, and IAMC are utilised to quantify their environmental effects, thereby providing a scientific basis for optimal design [8]. The LCA method is used to analyse the environmental impact of assembled buildings.
Assessment of the potential for reducing carbon emissions: the majority of current research is conducted from a single perspective, but a comprehensive evaluation necessitates the establishment of an integrated carbon emission prediction model. There has been considerable international interest in the ecological impact, sustainable development and Life Cycle Assessment (LCA) evaluation of assembled buildings. It is recommended that future research be conducted in a multidisciplinary and multi-perspective manner in order to provide a comprehensive evaluation of the potential of assembled buildings in carbon emission reduction [9].
Factors influencing carbon emissions: The carbon emissions of assembled buildings in China are influenced by a multitude of factors, the regulation of which necessitates an understanding of their interconnections and relative importance. A number of mature research methods and measurement models have been developed at home and abroad, including the IDA, Kaya constant equation method, STIRPAT modelling method and so on. The study predicts the trend of carbon emissions of specific buildings and proposes emission reduction strategies. Nematchoua et al., predicted carbon emissions during three key periods of its operation by building on this foundation and utilising software such as Design Builder with Pleiades. The study demonstrates that a landmark in the United States will increase its carbon emissions by 10.6% by 2050, whereas a building in Shanghai, China will increase its carbon emissions by 7.8%. Francis et al., address the issue of "decoupling" in subsidised housing in India through the utilisation of system dynamics modelling and the implementation of reasonable "decoupling" strategies. This approach is expected to result in a 40% reduction in carbon emissions. It is anticipated that the reduction target will be approximately 40%.
Nevertheless, the extant research is largely confined to static perspectives or discrete levels, exhibiting a paucity of comprehensive and penetrating multi-factor system dynamics analysis. Accordingly, this project will employ system dynamics and feedback control theory, integrated with software modelling, to simulate and predict the evolution of assembled buildings, and utilise multiple
techniques to guarantee the precision of the outcomes.
Materials and Methods
System boundaries and subsystems
System dynamics addresses the nonlinear problems inherent to complex systems, with a particular focus on the intersections between different disciplines. In this project, the assembly building area is taken as the research object, with a dynamic model of the Darfon path constructed using Vensim software. This model is then used to compare and analyse a number of scenarios.
The project analyses the interaction of five major subsystems, including socio-economics, market supply and demand, with a particular focus on the interaction between the economy, science and technology, education and population in order to promote emission reduction. The demographic shift has a multitude of ramifications, with energy optimisation and efficiency improvement representing the pivotal means to achieve carbon reduction. The growth of the economy and the expansion of industrial output represent the primary drivers of carbon emissions.
The economic indicators include the Gross Domestic Product (GDP): The value added of the three main industrial sectors, the GDP growth rate, the GDP per capita and the level of fixed asset investment. Collectively, these indicators provide a comprehensive reflection of the scale and growth rate of the economy, and thus indirectly influence carbon emissions.
Market supply and demand-side: From the perspective of supply and demand, the assembly building market is affected by a number of factors, including the introduction of a new area, the balance between supply and demand, cost-effectiveness and building scale. Collectively, these factors provide a comprehensive overview of the market.
With regard to scientific and technological innovation: It can be observed that such innovation plays a pivotal role in driving energy transformation and industrial structure optimisation, promoting clean energy development and reducing carbon emissions. The joint promotion of scientific and technological innovation through the input of scientific and technological elements, human capital, innovation capacity and other factors is a key driver of sustainable development.
Government policy level: In facilitating the advancement of China's assembly industry, the government plays a pivotal role. The policies in question can be broadly classified into the following categories: The establishment of a standardised system to promote standardised production; increased investment in science and technology innovation to encourage technological innovation; financial subsidies to reduce enterprise costs; and policy support to create a favourable development environment. These policies collectively facilitate the sustained growth of the assembly industry.
Energy consumption of buildings: The energy consumption of buildings represents a pivotal indicator for the assessment of carbon emissions, encompassing the manufacturing of materials and the daily consumption of energy (such as that used for heating, cooling, and lighting). The generation of carbon emissions is contingent upon a number of factors, including the efficiency of the energy consumed, the selection of equipment utilised, and the design of the building itself. A comprehensive evaluation of these factors can facilitate the assessment of building carbon emissions and provide a foundation for the development of effective emissions reduction strategies.
Flow chart analysis
In accordance with the established parameters of the system boundary, an in-depth examination was conducted to elucidate the underlying mechanisms and interactions of the constituent elements within the system. This was followed by the construction of a causality diagram (Figure 1), which serves to illustrate the complex interconnectivity and causal relationships within the system. In order to provide a comprehensive reflection of the characteristics of the carbon emission system of assembled buildings, a total of 47 variables were selected. These included four state variables, which describe the core state; five velocity variables, which reflect the speed of state change; three constants, which provide a stabilisation benchmark; and 35 auxiliary variables, which have a multi-dimensional coverage to ensure a complete and accurate model. While it is not feasible to enumerate all the variables, the principal and significant variables have been delineated in (Table 1) for the reader to comprehend the primary considerations in model construction.
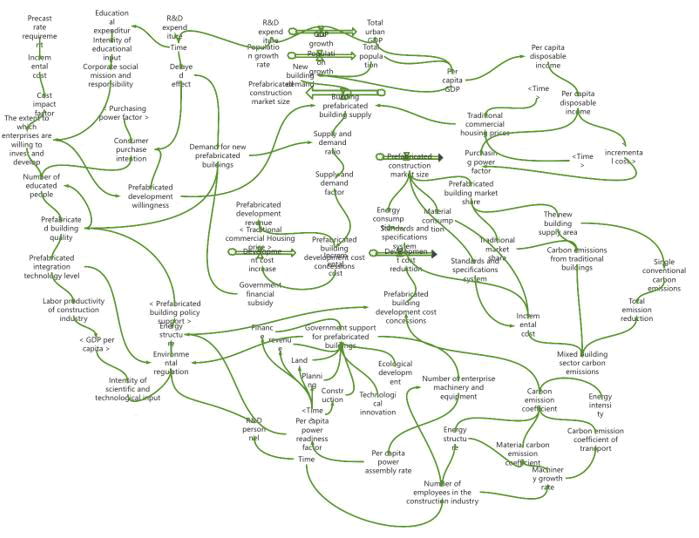
Figure 1: Carbon emission system flow of prefabricated buildings.
| Key variables | Explanation or clarification |
| R and D staff | Research and experimental development personnel equivalent full-time equivalents per person |
| R and D expenditures | Internal expenditures for research and experimental development/$10,000,000 |
| Intensity of scientific and technological investment | Ratio of internal expenditure on research and experimental development to regional GDP/% |
| Number of persons educated | Number of graduate students enrolled/person |
| Expenditure on education | General tertiary education expenditure/$10,000,000 |
| Education investment intensity | Ratio of expenditure on education in general higher education institutions to GDP/% |
| Technological innovation | Number of patent applications received for inventions/piece |
| Energy intensity | Amount of energy consumed by 10,000 tons of GDP/t |
| Energy structure | Proportion of coal consumption to total energy consumption/% |
| Environmental regulation | Ratio of investment in industrial pollution control to regional GDP/% |
Table 1. The following section provides a description of the principal variables of the model.
System parameterization
The system is founded upon the Statistical Yearbook, the China Real Estate Statistical Yearbook and a number of housing security and construction information networks. It draws upon these sources to retrieve information, which it then subjects to in-depth exploration and integration within authoritative databases such as the Statistical Yearbook. By employing mathematical statistics and in-depth analytical techniques, the system performs a comprehensive and detailed examination of pivotal formulas and parameters, thereby establishing a robust data foundation and a decision-making framework for the advancement of assembly construction in Shanxi.
This study employs the carbon emission factors set forth by the IPCC guidelines, which are converted into tons, to evaluate the specific carbon emissions of assembled buildings in Shanxi. This analysis provides a quantitative basis for assessing the environmental impact of these buildings in the region see (Table 2).
| Type of energy | Raw coal | Coke (processed coal used in blast furnace) | Concrete (C30) | Steel reinforcing bar | Plate | AA blocks | AAC board | Wooden formwork | Electricity (East China) |
| Standard coal factor | 0.7143 | 0.9714 | 2.295 | 2.3441 | 2.4 | 2.3 | 2.6 | 1.463 | 0.7921 |
| Carbon emission factor | 0.7559 | 0.855 | 0.6753 | 0.6573 | 0.5671 | 0.452 | 0.5902 | 0.125 | 0.341 |
| Data sources | Standard for calculating carbon emissions from buildings | The life of a typical wall material periodic evaluation | Tsinghua University, "Physical stage of building products carbon footprint evaluation methodology and empirical research" | Baseline emission factors for the Chinese regional grid for the 2019 emission reduction project | |||||
Table 2. Presents the conversion coefficient and carbon emission coefficient of standard coal from a range of energy sources.
The total carbon emissions of assembled buildings are as follows:

The location of the aforementioned item is as follows: The symbol "I" represents the total carbon emissions for the specified year (10,000 tonnes). The subscript "i" denotes the type of energy consumption, with "I", "Ni", "Mi" and "Fi" representing the carbon emissions for the ith type of energy (10,000 tonnes), energy consumption (10,000 tonnes), the converted standard coal coefficient (tce/t) and the carbon emission coefficient (tce/t), respectively.
On this basis, a new mathematical model is established for the prediction of dynamic patterns of carbon emissions in assembly building regions, comprising a constant method, a mean value method, a direct assignment method and regression analysis. The constant method is employed for parameters that remain constant over time, such as environmental control. The mean value is used for parameters that exhibit fluctuations, such as fertility. Initial values for state variables, such as total population and GDP, are assigned directly based on historical data. Regression analysis is utilized for parameters that exhibit significant fluctuations and irregularities. The system flow diagram incorporates all of the aforementioned factors to create a comprehensive model that illustrates the fluctuations in carbon emissions. Due to space limitations, only the principal parameters are presented in tabular form (Table 3).
| Main parameters | Functional relationship between the main parameters |
| Carbon footprint | Carbon emissions=EXP (56.411-56.82l) × EXP (environmental regulation) + 0.393 × EXP (energy mix) + 0.72812 × LN (total energy consumption) - 1.574e-06 × technological innovation + 0.389 × LN (total population) |
| technological innovation | Technological innovation= -264689 + 0.63465 × number of persons educated + 13400.8 × LN ("R&D personnel") |
| R and D staff | R and D personnel=EXP (7.56767 + 0.2670 × LN (total population) + 2.67e-12 × "internal expenditure on R and D funding") |
| Number of persons educated | Number of persons in education=EXP (6.9012 + 0.30221 × LN (total population) + 6.0971e-12 × expenditures on education |
Table 3. Presents the principal variables and equations of the model.
Model validity test
The validity test compares the model predictions with the actual data on GDP per capita and total population in Shanxi from 2010 to 2021. It confirms that the discrepancy between the two is within ± 10%, which is much lower than the acceptance threshold of 15%. This verifies the high accuracy and reliability of the model. The model is
characterised by a high degree of accuracy and reliability (Table 4). The data demonstrate that the model accurately captures the essential economic and demographic trends, indicating that its construction is based on scientific and objective principles. This effectively supports the analysis and prediction of Shanxi's economic situation and population dynamics, enhancing confidence in the model's predictive ability and practical application prospects.
| Timing | GDP per capita in dollars | Total population (10,000 persons) | ||||
| Actual value | Analog value | Percentage error/% | Actual value | Analog value | Percentage error/% | |
| 2010 | 37792 | 37703.7 | -0.23% | 847.41 | 847.41 | 0.00% |
| 2011 | 44641 | 43291.1 | -3.02% | 850.36 | 876.05 | 3.02% |
| 2012 | 51214 | 48282.6 | -5.72% | 854.47 | 905.67 | 5.99% |
| 2013 | 57876 | 53009.1 | -8.41% | 858.81 | 936.27 | 9.02% |
| 2014 | 64790 | 59634.2 | -7.96% | 862.75 | 937.92 | 8.71% |
| 2015 | 68457 | 64317.8 | -6.05% | 870.59 | 950.64 | 9.20% |
| 2016 | 72944 | 69985.4 | -4.06% | 883.21 | 964.46 | 9.20% |
| 2017 | 77803 | 75404.7 | -3.08% | 961.67 | 989.42 | 2.89% |
| 2018 | 86638 | 79937.3 | -7.73% | 1000.37 | 1065.57 | 6.52% |
| 2019 | 92256 | 91640.8 | -0.67% | 1020.35 | 1102.94 | 8.09% |
| 2020 | 98237 | 94894.4 | -3.40% | 1295.29 | 1181.57 | -8.78% |
| 2021 | 86427 | 87620.8 | 1.38% | 1316.3 | 1221.51 | -7.20% |
| 2022 | 86321 | 87589.98 | 1.47% | 1319.09 | 1234.09 | -6.44% |
Table 4. Test results of model validity.
Results and Discussion
Simulation parameters and scenario settings: The objective of this project is to examine the carbon emission system of assembled buildings and to construct a dynamic prediction model. In order to establish a baseline, the data from 2010 has been selected as the point of reference. In order to identify the key factors that may influence the system, a number of variables have been selected for analysis, including industrial structure, energy consumption, environmental protection and scientific and technological innovation. Six carbon emission scenarios
have been devised, each characterized by low, medium and high rates of change. The medium rate is based on the average of historical data, while the high and low rates have been combined with the 14th Five-Year Plan and 2035 targets for Shanxi. Specific consideration is given to the scientific and technological investment intensity of assembly buildings in Shanxi, with reference to the 14th Five-Year Plan. The mid-range growth rate is set at 5%, and the high rate at 10%. The scenarios and adjustment variables are set out in detail in (Tables 5 and 6), which provide an important basis for accurately assessing the impact of the policy.
| Sight | Percentage of fixed asset investment in the tertiary sector | Energy intensity | Energy structure | Environmental regulation | Intensity of scientific and technological investment |
| Baseline scenario (A1) | Center | Center | Center | Center | Center |
| Industrial structure optimization scenario (A2) | Your (honorific) | Center | Center | Center | Center |
| Energy saving and emission reduction scenarios (A3) | Center | Lower (one's head) | Lower (one's head) | Center | Center |
| Environmental scenarios (A4) | Center | Center | Center | Your (honorific) | Center |
| Low-carbon technology scenarios (A5) | Center | Center | Center | Center | Your (honorific) |
| Coordinated development scenarios (A6) | Your (honorific) | Lower (one's head) | Lower (one's head) | Your (honorific) | Your (honorific) |
Table 5. Outlines the carbon emission scenario settings for assembled buildings.
| Sight | Percentage of fixed asset investment in the tertiary sector | Energy intensity | Energy structure | Environmental regulation | Intensity of scientific and technological investment |
| Baseline scenario (A1) | 0/1/1 | -0.3125 | 4.0/-4.5/1.5 | 0.040/0.075/0.150 | 6.0/3.3/5.0 |
| Industrial structure optimization scenario (A2) | 0.21/1.2/11.21 | -0.3125 | 4.0/-4.5/1.5 | 0.040/0.075/0.150 | 6.0/3.3/5.0 |
| Energy saving and emission reduction scenarios (A3) | 0/1/1 | -3.6 6/-3.6 6/-3.66 | -0.27907 | 0.040/0.075/0.150 | 6.0/3.3/5.0 |
| Environmental scenarios (A4) | 0/1/1 | -0.3125 | 4.0/-4.5/1.5 | 0.050/0.100/0.200 | 6.0/3.3/5.0 |
| Low-carbon technology scenarios (A5) | 0/1/1 | -0.3125 | 4.0/-4.5/1.5 | 0.040/0.075/0.150 | 6.5/3.5/10.0 |
| Coordinated development scenarios (A6) | 0.21/1.21/1.21 | -3.6 6/-3.6 6/-3.66 | -0.27907 | 0.050/0.100/0.200 | 6.5/3.5/10.0 |
Table 6. Carbon emission parameter settings for assembled buildings.
The baseline scenario (A1) is as follows: In the absence of any change in the economic growth mode, and with the median value of the adjustment variables taken as the baseline, the future carbon emission pattern of assembled buildings is simulated and its environmental impact predicted. This is done in order to provide data support for a comprehensive understanding of its development trend.
Industrial structure scenario (A2): This paper examines the influence of industrial structure adjustments on the carbon emissions of assembled buildings, with a particular focus on the shift in the proportion of fixed investment in the tertiary industry, while holding other variables constant. The simulation analysis demonstrates that optimising industrial structure, particularly increasing the proportion of the tertiary industry, in conjunction with the utilisation of assembled buildings, can markedly reduce carbon emissions and furnish scientific justification for policy formulation.
The energy saving and emission reduction scenario (A3): Entails the construction of a carbon emission model for assembled buildings, with a particular focus on the reduction of energy structure and density, while setting other variables at intermediate values. The objective is to analyse regional energy consumption, propose energy saving and emission reduction policies, reduce the proportion of coal, optimise the energy structure, improve energy efficiency, promote sustainable development, reduce carbon emissions and support the national green low-carbon strategy.
Environmental scenario (A4): In constructing the carbon emission model for assembled buildings, a high environmental control value is set to simulate the impact of strict environmental protection policies, while the remaining variables are set to intermediate values to ensure consistency. The objective of this study is to analyse the impact of measures such as increased environmental control by regional governments and industrial pollution control investment on future carbon emissions. The aim is to promote the green transformation of the industry, reduce carbon emissions and promote sustainable development.
In the carbon emission model for assembled buildings, the intensity of high-tech inputs is set to explore its carbon reduction effect, while the remaining variables are assigned a median value. It is anticipated that high-tech inputs will facilitate technological innovation, enhance energy efficiency, and curtail carbon emissions, underscoring the pivotal role of technology in sustainable development and combating climate change.
The coordinated development scenario (A6): Entails the construction of a carbon emission reduction model for assembled buildings. This model targets solid investment in the manufacturing industry, environmental control, and investment in science and technology. Furthermore, it optimises the energy structure by selecting the minimum value of energy composition and density. The objective of
this empirical analysis is to study the effect of coordinated development on carbon emissions and to propose policy recommendations that will facilitate energy saving, efficiency and green development.
System simulation prediction
This project employs the carbon emission system of assembled buildings in the Shanxi region as its research object, conducting a detailed simulation across six different scenarios to predict the future development of carbon emissions. The results of the detailed simulations, which were conducted over a one-year period, are presented in (Figures 2-4) and illustrate the carbon emissions associated with each scenario. The mean cumulative carbon emission reduction in comparison to the baseline scenario is presented in Table 8. The study offers insights into the carbon emissions of assembled buildings, thereby providing a basis for informed decision-making.
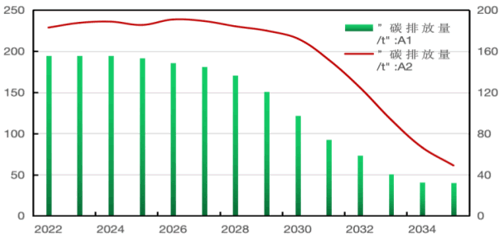
Figure 2: "Carbon emissions/t": A1; "Carbon emissions/t": A2.
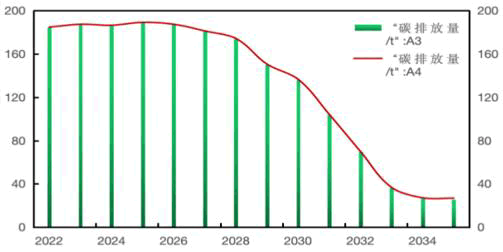
Figure 3: "Carbon emissions/t": A3; "Carbon emissions/t": A4.
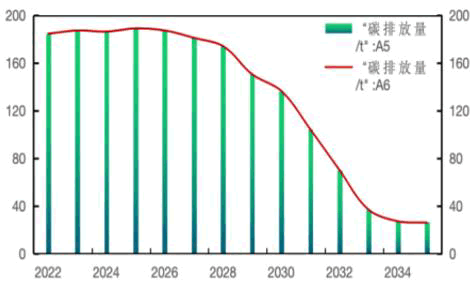
Figure 4: "Carbon emissions/t": A5 "Carbon emissions/t": A6.
System simulation results and emission reduction potential analysis
Baseline scenario (A1): As illustrated in Figure 2, carbon emissions from assembled buildings in the Shanxi region exhibited a stabilization following the peak observed in 2010, with emissions reaching nearly zero prior to 2010. This finding aligns with the conclusions of the preceding study. On this basis, the planned completion of the emission reduction is 2023, with an anticipated reduction of 185.267 million tons. While this has not yet been reached, the imminent reduction in emissions is in line with the "14th Five-Year Plan," which was put forward with the objective of "reducing emissions, achieving carbon neutrality, and implementing the Action Plan for Peak Achievement." The current operational mode of the system results in an ongoing increase in carbon emissions, making it challenging to reach the projected peak by 2030. In light of the aforementioned considerations, this project proposes an extension of the target period for emission reduction to 2035. It is further suggested that the carbon emission reduction target cannot be reached before 2035.
Industrial structure optimisation scenario (A2): A comparison of the secondary and tertiary industries reveals that, although the individual tertiary industries also generate carbon emissions, their carbon emission intensity is typically lower than that of the secondary industry. In the context of industrial structure optimisation, the objective is to incrementally augment the allocation of fixed asset investment within the tertiary industry, in alignment with the
prevailing economic development paradigm. This approach is designed to facilitate a gradual transition from the secondary to the tertiary industry. The proportion of the tertiary industry in the tertiary industry structure in Shanxi has reached 83.9%. However, as demonstrated in (Table 7), despite the completion of the total carbon emissions of assembled buildings, the continuous optimisation of the industrial structure can make a significant contribution to the reduction of carbon emissions. It is anticipated that the mean annual carbon emissions for the period 2022-2035 will be 11.27% lower than in the reference scenario. This provides considerable scope for further reductions in carbon emissions in the Shanxi region. The data in (Tables 7 and 8) provide further evidence that the Shanxi region is in a post-industrialisation transition period. The optimisation of the industrial structure has been demonstrated to significantly reduce carbon emissions, although the process of emission reduction is not accelerated. It is anticipated that an increase in the proportion of fixed asset investment in the tertiary industry will result in a reduction of approximately 49,000 tons of carbon emissions, representing a cumulative decrease of 0.75% from 2022 to 2035. At the present time, the secondary industry constitutes a substantial proportion of the industrial sector in the middle of Shanxi, while investment in the tertiary industry plays a significant role in the reduction of emissions. Nevertheless, even with optimisation, it will remain challenging for Shanxi's carbon emissions to reach their peak by 2035. Consequently, there is a need to intensify efforts to reduce emissions and to investigate further measures.
| Sight | Carbon emission projection rows | |||||
| Timing | 2022 | 2025 | 2028 | 2031 | 2033 | 2035 |
| Baseline scenario (A1) | 391.88 | 393.12 | 395.8 | 41064 | 417.89 | 436.65 |
| Industrial structure optimization scenario (A2) | 889.32 | 892.52 | 898.22 | 926.49 | 940.83 | 962.25 |
| Energy saving and emission reduction scenarios (A3) | 1292.97 | 1298.05 | 1305.9 | 1345.44 | 1365.85 | 1389.02 |
| Environmental scenarios (A4) | 371.88 | 390.12 | 405.8 | 39064 | 437.89 | 346.65 |
| Low-carbon technology scenarios (A5) | 679.32 | 802.52 | 808.22 | 936.49 | 960.83 | 1002.25 |
| Coordinated development scenarios (A6) | 1280.97 | 1198.05 | 1395.9 | 1375.44 | 1405.85 | 1429.02 |
Table 7. Presents the projected carbon emissions under a range of scenarios.
| Sight | Ratio of decrease in average cumulative carbon emissions over the projection period compared to the baseline scenario | |||||
| Timing | 2022 | 2025 | 2028 | 2031 | 2033 | 2035 |
| Baseline scenario (A1) | 28.16% | 30.54% | 30.84% | 31.38% | 31.95% | 32.49% |
| Industrial structure optimization scenario (A2) | 28.25% | 30.64% | 31.94% | 32.48% | 33.02% | 33.55% |
| Energy saving and emission reduction scenarios (A3) | 28.44% | 31.73% | 33.21% | 33.77% | 34.30% | 34.85% |
| Environmental scenarios (A4) | 28.94% | 32.99% | 34.66% | 35.26% | 35.78% | 36.34% |
| Low-carbon technology scenarios (A5) | 29.51% | 34.44% | 36.07% | 36.69% | 37.20% | 37.78% |
| Coordinated development scenarios (A6) | 30.03% | 37.03% | 37.27% | 37.92% | 38.43% | 39.03% |
Table 8. Presents the ratio of the decrease in average cumulative carbon emissions over the projection period under different scenarios in comparison to the baseline scenario.
Energy saving and emission reduction scenarios (A3): In the context of an energy conservation and emission reduction scenario, the country implements a proactive energy policy, accelerates the optimisation of energy intensity and composition, proposes and largely achieves the carbon emission reduction target of reaching the peak, and the proportion of clean energy consumption exceeds 60%. Initially, there is a notable decline in carbon emissions, which subsequently decelerate. In the period between 2022 and 2035, in comparison with the baseline scenario, the average reduction in carbon emissions is 1.76%. However, the energy structure is dominated by coal, accounting for 90% of the province's energy consumption, which presents a significant challenge. Following the implementation of the energy policy, it is anticipated that cumulative carbon emissions will be reduced by 3.93% in comparison to the baseline scenario. Furthermore, the optimisation of the industrial structure is expected to result in a reduction of carbon emissions by 7.43%. The reinforcement of the policy's implementation may result in a reduction of peak emissions by 4.345 million tons by 2022. Nevertheless, it will remain a challenge to reach the peak by 2030. The project is concerned with the scientific issue of carbon emission reduction.
Environmental scenarios (A4): The implementation of environmental protection measures has been demonstrated to be an effective strategy for the reduction of carbon emissions. However, it is notable that there are significant regional variations in the effectiveness of such measures. The Shanxi assembly building is currently in the "post-industrialisation" stage, with a reasonable industrial structure and a notable advantage in energy consumption. An increase in industrial pollution control inputs has resulted in a reduction of 11.71% in cumulative carbon emissions in Shanxi during the forecast period, in comparison to the baseline scenario. This highlights the significance of environmental protection inputs.
Nevertheless, it is evident that an increase in environmental protection inputs has a restricted impact on the reduction of carbon emissions, with a mere 0.23% decline. Consequently, when advocating for the environmentally sustainable development of assembled buildings in Shanxi, it is essential to concurrently prioritise environmental investment, industrial structure optimisation, and energy efficiency enhancement. Concurrently, it is imperative to eschew the development paradigm of "pollution first and then governance," to adhere to a sustainable development strategy, and to guarantee that economic growth and environmental quality are aligned.
Low carbon technology scenarios (A5): The current pattern of economic growth, coupled with increased investment in science and technology, has a positive impact on cumulative carbon emissions. However, the average reduction in emissions is only 0.84 percent and 0.33 percent, respectively, compared with the baseline scenario. This indicates that a single policy would have a constrained impact on carbon emission reduction in certain regions.
While it is not feasible to reach the peak earlier, increased investment in R&D can significantly reduce the peak. This is evidenced by a projected carbon reduction of 2.245 million tons and a cumulative carbon emission reduction of 3.67% over the projection period in comparison to the baseline scenario. The results demonstrate that while investment in science and technology does not immediately result in a notable reduction in emissions, continued and sustained investment in R&D can provide a robust foundation for long-term carbon emission reduction.
Coordinated Development Scenarios (A6): Based on a range of variables, including industrial structure, energy intensity, energy mix, environmental regulation, and scientific and technological inputs, we have designed a series of integrated optimisation scenarios (A2-A6) to simulate coordinated and balanced regional development, with the aim of promoting carbon emission reduction. It is anticipated that between 2022 and 2035, these scenarios will result in an average reduction of 1.75% in carbon emissions. Furthermore, the deferred emission reduction target is projected to reach a peak of 178.675 million tons by 2021, representing a reduction of 7.592 million tons from the baseline scenario. Over the forecast period, the cumulative reduction in carbon emissions will be 8.4% in comparison to the baseline scenario. Furthermore, the total carbon emissions are projected to be 1298.63 million tons in 2030, representing a cumulative reduction of 13.09% over the entire forecast period. These findings substantiate the efficacy of the integrated optimisation strategy in facilitating carbon emission reduction and sustainable regional development.
Conclusions and Recommendations
This project constructs a carbon emission model for assembled buildings, sets up six scenarios, regulates the industry, energy consumption, environmental regulation, scientific and technological inputs, etc., simulates the regional carbon emission trend, evaluates the emission reduction paths and targets, and the results are as follows:
• The baseline scenario indicates that CO2 emissions have already reached their peak and are projected to decline to 12,980,500 tons by 2025. However, the ambitious goal of achieving zero emissions by 2035 presents a significant challenge.
• The impact of a single regulatory measure varies across different regions. In descending order of impact, the factors are environmental control, industrial structure, energy consumption and science and technology input. This indicates that environmental control has the most significant effect on carbon emission reduction, while science and technology input has the least. In terms of the impact on carbon emissions, the following order can be observed: Energy consumption, science and technology, industry. It can be seen that environmental control has a significant effect on the reduction of carbon emissions, while the effect of scientific and technological inputs is relatively small. Among the single measures, energy consumption regulation has the most obvious effect.
• In the prediction model, the cumulative carbon emissions are projected to decline by 13.57%, 8.4%, and 13.09% relative to the baseline scenario. It can be observed that a stable economic expansion will facilitate a reduction in emissions within the assembly building region. This may be achieved through the expansion of the tertiary sector, a reduction in energy intensity, a decrease in coal consumption, the curbing of pollution, and an increase in investment in science and technology.
In light of the aforementioned considerations, a series of differentiated carbon emission and emission reduction pathways have been proposed, with due consideration given to the specific conditions prevailing in the various regions of the assembly building.
• Optimisation of policies and systems: As a sector at the vanguard of emission reduction, the construction industry should augment its investment in pollution control, particularly through enhanced environmental regulation and augmented industrial pollution control. Policies and systems should be enhanced, drawing on both domestic and international experience, in order to guarantee the existence of synergies between different policies. This may be achieved by means of strengthening source control, optimising environmental protection taxes and sewage permit systems.
• Regionalised energy policies in regions where coal and oil are the dominant energy sources, such as Shanxi, the formulation of energy policies assumes great importance with regard to the control of carbon emissions. It is imperative to exercise strict control over the utilisation of petrochemical resources and to facilitate the transformation of the energy structure. Furthermore, due consideration must be given to the dual impact of energy policies on carbon emissions and emission reduction.
• Industrial structure adjustment: the elimination of obsolete production capacity, the optimisation of industrial structure, and the implementation of rigorous controls over high-pollution and high-emission industries. It is recommended that the development of manufacturing and service industries be promoted into high-value-added areas, that dependence on coal resources be reduced, and that industrial optimisation and upgrading be accelerated.
• The advancement of scientific and technological innovation and transformation: It is imperative that the government assumes a guiding role in the advancement of scientific and technological innovation, strives to enhance the alignment between scientific and technological inventions and industrial production, and expedites the efficacy of scientific and technological transformation. This approach is essential to facilitate the attainment of the emission reduction target by 2030. Inter-regional cooperation: It is recommended that assembled building enterprises reinforce inter-regional collaboration and establish a collaborative approach to emission reduction. By engaging in collaborative research and development of low-carbon technology and the establishment of a carbon emission rights trading platform, they can collectively advance the reduction of carbon emissions in assembly building regions. Furthermore, a comprehensive analysis of energy allocation should be conducted, with the objective of optimising and upgrading the industry and energy structure through innovation.
References
- Li F, Xu Z, Ma H (2018) Can China achieve its CO2 emissions peak by 2030?. Ecol Indic 84:337-344.
- Xu G, Schwarz P, Yang H (2020) Adjusting energy consumption structure to achieve China's CO2 emissions peak. Renew Sustain Energy Rev 22:109737.
- Yuan J, Xu Y, Hu Z, Zhao C, Xiong M, et al. (2014) Peak energy consumption and CO2 emissions in China. Energy Policy 68:508-523.
- Niu S, Liu Y, Ding Y, Qu W (2016) China’s energy systems transformation and emissions peak. Renew Sustain Energy Rev 58:782-795.
- Nematchoua MK, Asadi S, Obonyo E, Reiter S (2022) Environmental analysis of health damages coming from a residential neighborhood built in 150 countries. J Hous Built Environ 37:1643-1665.
- Persson S, Malmgren L, Johnsson H (2009) Information management in industrial housing design and manufacture. J Inf Technol Constr 14:110-122.
- Chang L, Guoping T (2015) Simulation analysis of national low-carbon development strategy scenarios based on system dynamics. Syst Eng 33.
- Qimin C, Huaqing X (2015) Research on the realization path of China's peak carbon emission target based on IAMC model. China Popul Resour Environ 25:37-46.
- T/CCES 14-2020, Classification and coding standard for assembled building parts and components. Beijing: China Construction Industry Press, 2020.


Open Access Journals
- Aquaculture & Veterinary Science
- Chemistry & Chemical Sciences
- Clinical Sciences
- Engineering
- General Science
- Genetics & Molecular Biology
- Health Care & Nursing
- Immunology & Microbiology
- Materials Science
- Mathematics & Physics
- Medical Sciences
- Neurology & Psychiatry
- Oncology & Cancer Science
- Pharmaceutical Sciences