Prediction of the State of Cell Membrane Potassium Channel
Somayyeh Shahhosseini, Soheila Esmaeili P, S.H. Sabzposhan
Department of Biomedical Engineering, Iran University of Science and Technology (IUST), Tehran, Iran
- Corresponding Author:
- Soheila Esmaeili P
Department of Biomedical Engineering
Iran University of Science and Technology (IUST), Tehran, Iran
E-mail: Soheila.bluestar@gmail.com
Abstract
In this paper, we have presented a method to predict the state of cell membrane Potassium channel in different voltages by using Markov model. One feature of models which are based on Markov is the demonstrating transition states so that prediction of ion channel behaviour will be possible. In this research, model parameters are obtained by Linearization of Macroscopic current, and then the probability of transfer from one state to another is calculated in terms of time and voltage. After that probability matrix of state changes of Markov model was found. By use of this matrix prediction of channel state in different voltages will be possible. In this article, the predicted channel state for 100 future states will be shown. Accuracy of this model is assessed by comparison between actual channel conductance that is obtained from macroscopic current of the software in different voltages and conductance that is obtained from the considered model. One of the most important advantages of this method of modelling is the capability of predicting the behaviour of ion channels in different voltages.
Keywords
Channel status; Ion channels; Markov model.
Introduction
Ion channels have gates that regulate the channel permeability to ions. Crossing of ions existing in the cytoplasm through cell membrane depends on a phenomenon called gating behavior. Gating behavior is originated from the act that the ability of ions from membrane gates depends on membrane voltage. The reason of gating phenomenon is that proteins covering membrane surface, change their direction because of changes in direction and intensity of electrical field. Changing in the direction of a molecule due to a certain voltage leads to opening a gate.
This phenomenon called activation [1]. The same molecule may move in opposite direction under the effect of another voltage and cause that gate to get closed. This phenomenon called deactivation [2]. Some pores have several types of proteins so that some of these proteins change their direct to open the gate affected by a certain voltage, but some other proteins again close the gate by often slower moving. Consider that gate closing happens in the same voltage of gate opening but with a little delay. This phenomenon called inactivation. Gate opening and closing is controlled by following main methods [2]:
1-Voltage-dependent opening and closing;
2-Chemical opening and closing.
In voltage-dependent opening and closing, spatial structure of the gate molecule will change in response to electric potential between two sides of a cell membrane. Markov process is a random process that probability theories govern it. Different parts of Markov process are:
1-Set of states that may occur;
2-The initial state vector;
3-Probability matrix of state changing.
Previously proposed electrophysiological models for ion channels are not able to predict the status of channel [3],[4]. So in this research we intended to represent a model for predicting it based on Markov model for ion channel. The most important advantage of this modelling method is the ability of predicting the channel statues in different voltages it can be very helpful in patient treatment.
Materials and Methods
For modelling an ion channel by using Markov model, at first it is necessary to obtain the data of channel evaluated. Because in this research , it is not possible to access directly to the cellular environment and do an experiment to reach the actual data , we had to use the data obtained from a software environment called COR, which is an environment, compatible with the cellular condition. After data obtaining, we should find the model parameters. In models based on Markov, there is a direct relation between model parameters and stopping times in different states of channel, so it is necessary to apply a method so that we can specify channel states.
One of the most important advantages of the Markov model is the ability of showing the transition states and so making it possible to evaluate the details of process behaviour. The method of predicting a process is described as following:
If v is the initial condition vector and p is the probability matrix of state changing, the process state will change as follows:
New state= vp
Generally, the prediction of process state in step n is calculated as follows:
step n= vp
Generally, for modeling of ion channel by use of Markov model, at first it is necessary to obtain the data of evaluating channel. Because it was not possible to have direct access to cellular environment and do a laboratory test to obtain real data, we used COR software [5], an environment consistent with the cellular conditions to obtain data. After obtaining the data, we should find the model parameters. It is necessary to consider that the model parameters depend to different factors, such as voltage, and drugs. In this research, modelling is evaluated based on the parameters dependence to the voltage between two sides of channel. In models based on Markov there is a direct relation between model parameters and stopping time in different states of channel. Therefore, it is essential to apply a method so that we can specify channel states.
Applied methods for states Distinction is vorgelegt von and Yu-Kai [6]. This method is a method of linearization of channel macroscopic current [7]. After Distinction of different channel states, stopping times in each state will be found and then will be calculated model parameters by use of relations between continuous time Markov systems. Then, the probabilities of transfer from one state to another are calculated in terms of time and voltage. Consequently, we could find probability matrix of state changes of Markov. Then, by use of this matrix, prediction of channel state in different voltages will be possible. The results show that having the matrix of state changing in different voltages, prediction of the process of channel state changing will be possible. In this article, the predicted channel state for 100 future states will be shown.
Assessment criteria for accuracy of this model, is measured by comparison between actual channel conductance that is obtained from macroscopic current of the software in different voltages and conductance that is obtained from the considered model. Potassium Channel equations in Hodgkin-Huxley model are as follows:
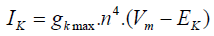 (1)
(1)
Regarding to the equation (1), we can consider a model with four similar actuator gates and for potassium channel as shown in figure 1. In this figure, C1: shows the state in which every four gates of channel are closed. C2: shows the state in which three gates of channel are closed and one is open. C3: shows the state in which two gates of channel are closed and two are open. C4: shows the state in which one gate of channel is closed and three others are open. O: shows the state in which every four gates of channel are open.

Figure 1: Markov model Considered for shown potassium channel. In, C1:4 gates are closed, C2:3 gates are closed and 1 gate is open, C3:2 gates are closed and 2 gates are open, C4:1 gates are closed and 3 gates are open, O:4 gates are open.
Regarding to Figure 1, model equations are as follows [8]:
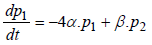 (2)
(2)
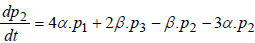 (3)
(3)
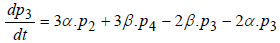 (4)
(4)
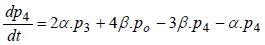 (5)
(5)
 (6)
(6)
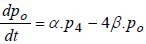
where P1 is the probability of channel being in state C1, P2 is the probability of channel being in state C2, P3 is the probability of channel being in state C3, P4 is the probability of channel being in state C4 and Po is the probability of channel being in state O.
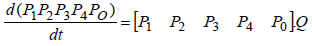
By rewriting above equations in closed form, it yields:
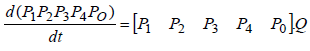
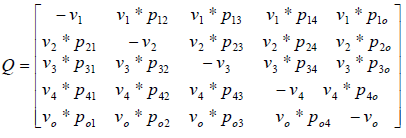
where matrix Q is:
In addition, in continuous-time Markov processes, the Coefficient matrix has a relation with stopping times, which means If x(t) is Markov process and Ti is stopping time in state i, and  then:
then:
Q=[qij] (7)
where
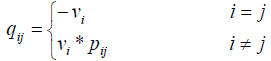
where Vi is the stopping time parameter and pij shows the probability of channel state changing from state i to state j. So matrix Q is as follows:
By equalization of two above matrix, model parameters are obtained.
Results
Data obtaining
In this research, date is obtained by voltage-clamp test in COR (cellular open resource) Software [5]. COR is software that contains cellular electrophysiological models. It has produced by researcher of Oxford University. Figure 2 shows the channel macroscopic current from a voltage-clamp test in a typical voltage 40 mV [9].

Figure 2: The channel macroscopic current in the voltage of 40 mili volt. Vertical axis is potassium channel macroscopic current in nano-amper and horizontal axis is time in milliseconds.
Channel state prediction in different voltages
In this stage, finding channel stopping times in each state is our aim. One method to obtain stopping time is to divide the current linearly. In this method, because the model considered has five different states, maximum current obtained of channel should be divided to five parts.
The minimum interval is assigned to state C1 in which every four gates are closed and so on the next intervals are assigned to state C2, C3, C4 and maximum interval to state O in which every four channels are open. With this method, we could find stopping times in each voltage and obtain the components of transition matrix from them. By equalization of matrix Q from two levels before, α,β coefficients in each voltage were calculated. After attaining the coefficients in each voltage and solving the above Ordinary Differential Equations (ode), the probability of channel being in each state was found in different voltages as shown in figure 3.

Figure 3: Probability of channel being in each state in different voltages. Horizontal axis is voltage in milivolts. p1, p2, p3, p4, and p5 are probability of channel being in state C1, C2, C3, C4, and C5. In low voltages the probability of channel being in first state is more than other states.
Figure 3 shows the probability of channel being in each state in different voltages. In this figure p1, p2, p3, p4 and p5 show the probability of channel being in state C1, C2, C3, C4 and C5, respectively. As Figure 3 shows, in low voltages the probability of channel being in first state is more than other states. So P1 is higher than other probabilities. It is obvious in the figure that Increasing in voltage, leads to increasing in the probability of channel being in next states.
As mentioned above:
Writing process equation in perfect form, we will have 25 ode’s. For example, the first equation is:
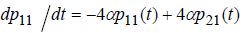 (8)
(8)
Calculating α and β coefficients in each voltage, the coefficients of above equations will be obtained in each voltage. Solving above equations in MATLAB, the probabilities of channel Status changing from one state to another in different voltages were found as shown in Figure 4.

Figure 4: The probabilities of channel Status changing from one state to another in different voltages
Figure 4 shows the probabilities of channel Status changing from one state to another in different voltages. So the probability matrix of state changing for above processes in different voltages is obtained. Having the probability matrix of state changing, channel behavior is predictable.One sample of 100 predictions of channel state in different voltages is as shown in Figure 5.

Figure 5: Mean number of occurrence of different states in each voltage in 100 times prediction. As voltage increases, the mean number of occurrence of last model states increases.
Figure 5 is the mean number of occurrence of different states in each voltage in 100 times prediction. In this figure in horizontal axis, number 1 is the voltage of 0 to 10, number 2 is the voltage of 11 to 20, number 3 is the voltage of 21 to 30, number 4 is the voltage of 31 to 40, number 5 is the voltage of 41 to 50 and number 6 is the voltage of 51 to 55. We can see that as voltage increases, the mean number of occurrence of last model states increases.
Discussions and Conclusions
Evaluating the Accuracy of the coefficients obtained is very significant. The accuracy of the obtained coefficient was assessed by comparison between actual channel conductance obtained from macroscopic current of the software in different voltages and obtained from the coefficients achieved from considered model that we will explain it below.
The diagram of current-voltage of potassium channel for Noble 2000 model by using COR is shown in Figure 6. The results of diagram of current-voltage of potassium channel obtained from modelling of a potassium channel with Random initial conditions are shown in Figure 7.

Figure 6: The diagram of current-voltage of actual potassium channel obtained from COR.

Figure 7: Diagram of current-voltage of potassium channel, macroscopic current.
In Figure 8, I mean is the average of simulated macroscopic current for 50 potassium channels and I real is the actual current. As we can see in these figures, this method of modeling has been able to simulate the macroscopic current of channel in different voltages.

Figure 8: The average of simulated macroscopic current (I mean) and actual current (I real). Vertical axis is potassium channel macroscopic current in nano-amper and horizontal axis is voltage in millivolt.
Previously proposed electrophysiological models for ion channels are not able to predict the status of channel. So in this research we intended to represent a Markov model for ion channel. The most important advantage of this modeling method is the ability of predicting the channel statues in different voltages.
The applied method for states Distinction is the method of linearization of channel macroscopic current. Then, we would find the model parameters by using stopping times. After that, having the model parameters we can calculate the probability matrix of state changes in each voltage and then it is possible to predict the channel state in each voltage.
In this article, to achieve result and to evaluate the accuracy of the represented method, we used the macroscopic current of potassium channel obtained from cellular Noble 2000 model.
As we see in the modelling results, increasing in the voltage leads to increasing in the probability of opening of the channel gates and the channel state goes toward state o. so the macroscopic current of channel will increase. These results are completely compatible with the existing data.
It should be noted that in this research, just the effect of voltage between two sides of channel on the performance of gates was evaluated. Considering that, the performance of channel gates depends on various factors such as drug, the environment temperature, enthalpy, etc. we can study the effect of these factors on opening and closing of channel in future researches to represent a complete Markov model, which is able to predict the channel behaviour under the effect of various factors. The most important advantage of this method of modelling is the ability of predicting so that it can be very helpful in patient treatment.
References
- Catterall, W.A., Cestèle, S., Yarov-Yarovoy, V., Yu F.H. , Konoki, K., Scheuer, T., (2007) Voltage-gated ion channels and gating modifier toxins. Journal of Toxicon, 49(2): 124-141.
- Fall, C.P., Marland, E.S., Wagner, J.M., Tyson, J.J., (2002) Computational Cell Biology, Springer, pp. 28- 32.
- Milescu, S., Akk, G., Sachs, F. (2005) Maximum Likelihood Estimation of Ion channel kinetics from Macroscopic Currents. Biophysical Journal, 88: 2494- 2515.
- Rudy, Y., Silva, J.R. (2006) Computational biology in the study of cardiac ion channels and cell electrophysiology. Q Rev Biophysics, 39(1): 57-116.
- COR ,Cellular open Resource, https://cor.physiol.ox.ac.uk
- The, Y.K. (2005) Analysis of ion channels with hidden markov models: parameter identifiability and the problem of time interval omission. PhD Thesis, Albert- Ludwigs-Universitaet Freiburg im Breisgau.
- The, Y.K., Wagner, M., Timmer, J. (2002) Method- independent effect in testing for detailed balance in ion channel gating. Biophysical Journal, 82(4): 2275-2276.
- Colquhoun, D., Hawkes, A.G. (1995) The principles of the stochastic interpretation of ion-channel mechanisms, 2rd Ed. Springer.
- Izhikevich, E.M. (2004) Dynamical Systems in Neuroscience: The Geometry of Excitability and Bursting, The MIT Press.


Open Access Journals
- Aquaculture & Veterinary Science
- Chemistry & Chemical Sciences
- Clinical Sciences
- Engineering
- General Science
- Genetics & Molecular Biology
- Health Care & Nursing
- Immunology & Microbiology
- Materials Science
- Mathematics & Physics
- Medical Sciences
- Neurology & Psychiatry
- Oncology & Cancer Science
- Pharmaceutical Sciences