Design a smart antibiogram test model: an applicable solution to control the global antibiotic resistance
Ghasem Rahimi*, Lucio Angnes and Masoud Negahdary
Department of Agriculture and Environmental Science, Shiraz University, Shiraz, Iran Department of Fundamental Chemistry, Institute of Chemistry, University of Sao Paulo, Sao Paulo, Brazil
Published Date: 2023-04-24Ghasem Rahimi1*, Lucio Angnes2 and Masoud Negahdary2
1Department of Agriculture and Environmental Science, Shiraz University, Shiraz, Iran
2Department of Fundamental Chemistry, Institute of Chemistry, University of Sao Paulo, Sao Paulo, Brazil
- *Corresponding Author:
- Ghasem Rahimi
Department of Agriculture and Environmental Science,
Shiraz University,
Shiraz,
Iran
Tel: 9809179207142
E-mail: rahimighasem75@yahoo.com
Received date: January 09, 2023, Manuscript No. IPEJBIO-23-15620; Editor assigned date: January 11, 2023, PreQC No. IPEJBIO-23-15620 (PQ); Reviewed date: January 25, 2023, QC No. IPEJBIO-23-15620; Revised date: April 17, 2023, Manuscript No. IPEJBIO-23-15620 (R); Published date: April 24, 2023, DOI: 10.36648/1860-3122.19.3.081
Citation: Rahimi G, Angnes L, Negahdary M (2023) Design a Smart Antibiogram Test Model: An Applicable Solution to Control the Global Antibiotic Resistance. Electronic J Bio Vol:19 No:3
Abstract
Antibiotics are the leading medicines used against bacterial, fungal, and viral infections. Nowadays, one of the concerns for patients, healthcare workers, researchers, and other related society members is the high resistance level of pathogenic bacteria against antibiotics. This phenomenon is not only specific to a country or a place, and it is becoming a global and severe problem for health. Pathogenic agents are found to be resistant to antibiotics with different methods. Selective pressure, acquired resistance, plasmid transfer, and inappropriate use of antibiotics by patients are major contributing factors to antibiotic resistance. However, laboratory diagnostic errors (humans and devices) are other challenges that are never considered enough. Here, we tried to design and present an accurate diagnostic tool by a smart antibiogram test. In the practical route, 150 samples of Uropathogenic Escherichia coli (E. coli) (UPEC) were separated from patients with a positive infection, and an antibiogram test was conducted on these samples using two different methods (manual system and automated system). Data analysis indicated that measurement error in manual and experimental methods always exists, and no supervisory and management method exists to control these errors. Preventing these errors and improving diagnostic tools in laboratories can have an influential role in the global phenomenon of bacterial resistance. By introducing and verifying the diagnostic tools introduced in this study and consequently creating an integrated management system for optimal antibiotic use, antibacterial resistance can be controlled globally.
Keywords
Antibiotic resistance; Antibiogram test; Smart laboratory diagnosis; Drug management; Bacterial resistance
Introduction
At the beginning of the 20th century, the discovery ofantibiotics highly helped the medical community, and it was a turning point in combating infectious microorganisms. The concerns related to the use of antibiotics were recognized around 1940, shortly after their introduction into the medical world. This event is one of the biggest challenges threatening human and environmental health. This resistance is rapidly increasing, and the researchers’ efforts for discovering a new antibiotic are like a marathon against microorganisms that these pathogeneses try to adapt to and become resistant to these antibiotics. This issue is globally, and if not be controlled, it can be said that antibiotics are not an appropriate option for treating infectious pathogens, and many people will die due to acute and chronic diseases [1,2]. In the case of a lack of appropriate control and management of antibiotics, the medical community will return to the pre-antibiotics era [3]. It should be considered that humans will face more resistant organisms, and subsequently, the most superficial infections will become the deadliest. Correct knowledge about the parameters involved in the resistance of organisms against antibiotics will help adopt a timely selection of a novel strategy for controlling this phenomenon and considering appropriate attention for the targeted use of antibiotics. Mutation and transfer of resistant genes among bacteria, synthesis of the enzymes that deactivate antibiotics, improper prescription of antibiotics by physicians, abuse of antibiotics by the patients, and most times, lack of continuous course for treatment by antibiotics are significant challenges that have a significant role in the emergence of antibiotic resistance.
Nevertheless, one of the factors that have not been considered enough is laboratory diagnostic errors (human and devices), which, unfortunately, there is no accurate report on its level. Mistakes in the name of the antibiotic, reading the test without measuring the inhibition zone (with eyes or experimentally), or inaccuracies in the measurement of the inhibition zone are formed, and even errors in reporting and other possible errors lead to incorrect prescribing and inefficient use of antibiotics and bacterial resistance to them increase dramatically [4]. This challenge becomes more critical when one considers that antibiotics used in laboratories may remain without review for several years. These errors can have a significant effect on the acquired resistance of bacteria. The recommended antibiotics for each gram-negative and gram-positive bacteria group include antibiotics that have enough controlling effect in both in-vivo and in-vitro conditions. An antibiogram susceptibility test determines the bacterial sensitivity/resistance against an antibiotic [5]. Antibiogram test is generally performed with the Kirby-Bauer model, and the sensitivity of a microorganism is measured and reported in millimeters, considering the inhibition zone formed against an antibiotic and its comparison with the standard table defined based on Clinical and Laboratory Standards Institute (CLSI) protocol.
Materials and Methods
On the other hand, the antibiotics used in the antibiogram test are collected annually by reputable authorities such as the CLSI by collecting data on antimicrobial resistance from around the world and analyzing these reports. The recommendation to eliminate or include antibiotics in each group of antibiotics should be based on clinical efficacy, determination of antimicrobial resistance and, selection of appropriate route to minimize this resistance, reasonable price of appropriate antibiotics for patients. Moreover, control of the valuable features (dose, type, quantity, quality, etc.) should be followed based on drugs protocols and rules [6]. Unfortunately, the antibiotics introduced by the relevant authorities may not enter the drug market of all countries and/or are expensive, and physicians are not willing to prescribe them; most importantly, these antibiotics are ineffective against local pathogens. Also, due to the dissatisfaction of some physicians with the results and types of antibiotics used in antibiograms by laboratories, the occurrence of antibiotic resistance in some strains, and the occurrence of emerging infectious diseases, continuous review of antibiotics used in antibiograms seems necessary. In addition, because the microbial flora varies from person to person and varies from region to region or country to country, an antibiotic may not show the same effect [7]. Therefore, creating an innovative diagnostic tool and an integrated global system to monitor the results of bacterial susceptibility or resistance patterns even in the most remote regions of the world can play an influential role in reducing the global phenomenon of antibiotic resistance.
Hypothesis
Bacteria may be resistant to antibiotics through selective pressure, plasmid transfer, and mutation. However, the main reasons for the fast resistance of bacteria against antibiotics are inappropriate and unnecessary prescriptions or false-prescription without doing antimicrobial sensitivity tests and human errors in antibiogram tests. It seems necessary to find accurate diagnostic tools in laboratories that can perform smart antibiogram testing in addition to ease of use [8]. The size of the inhibition zone can be calculated with very high accuracy (probable error ~0) using a smart and integrated system, and it is possible to present results quickly [9]. In addition, high accuracy can significantly affect antibiotic resistance by analyzing the results and comparing them with the standard protocol, determining effective antibiotics, and determining the course of antibiotic treatment without human involvement. In this regard, designing a smart and integrated antibiotic management system and creating a database based on the results of smart antibiogram testing can provide comprehensive and accurate information for the world health organization or the ministry of health in any country to inform about the exact detail of infections and also by evaluation of antibiotic susceptibility and resistance pattern can introduce appropriate antibiotics [10]. Antibiotic resistance can be prevented by adopting an effective strategy even in the most remote parts of the world.
Hypothesis testing
Urinary Tract Infection (UTI) is one of the most common infections in humans caused by Escherichia coli (E. coli). This bacterium was used for testing the hypothesis in this study. For this purpose, 150 UPEC samples were extracted from individuals who suffered from UTI. The use of real samples was based on informed consent and the declaration of Helsinki. All the bacterial strains were identified using standard biochemical methods in the bacteriology lab center of Raymon Rayan Spad Chain Co (Shiraz, Iran) [11]. The antibiotic sensitivity and resistance of the extracted strains were determined using the disc diffusion (Kirby-Bauer) method on Mueller–Hinton agar medium using Ampicillin discs (10 μg), Gentamicin (10 μg), Cefixime (5 μg), Ciprofloxacin (5 μg), and Co-trimoxazole (Trimethoprim 1.25 μg, Sulfamethoxazole 23.75 μg) discs. The inhibition zone measurement was done in two states. In the first state, the technicians of several laboratories without knowledge of the conditions and objective of the test were asked to measure and report the inhibition zone as usual. In the second state, to verify the measurements by technicians, the diagnostic tools designed in this study based on image processing for inhibition zone measurement were used. This tool, through image processing, measures the inhibition zone in a fully automated way and reports the results using CLSI data that has been defined for it before. In the last stage, the data obtained from each laboratory was sent and analyzed in a comprehensive system as a central data center in an online platform [12].
Results and Discussion
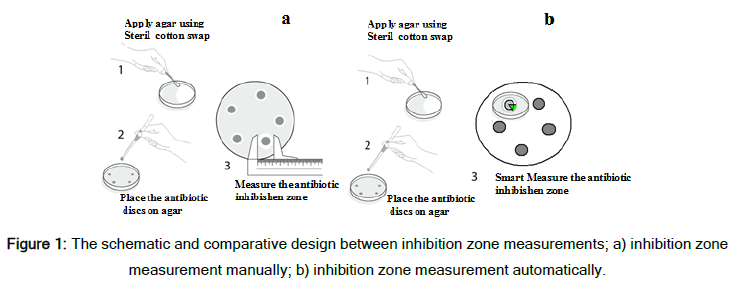
The sensitivity and resistance of the considered UPEC strains were assessed in two ways, i.e., manually by laboratory technicians and by using the device designed in this study. The schematic designs of these two methods are shown in Figure 1.
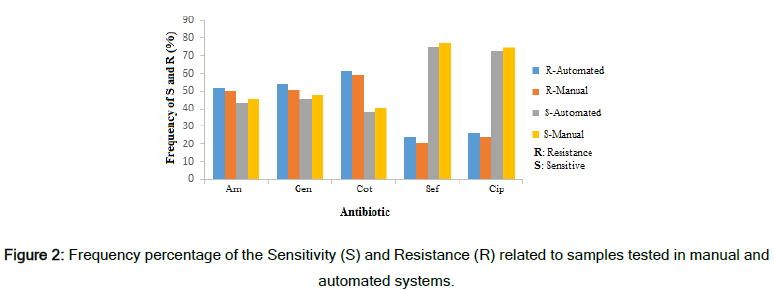
Table 1 shows the results of E. coli susceptibility and resistance against the antibiotics used in two different measurement methods. The results showed that the samples sensitive to the antibiotics assessed had a higher number and higher percentage in the manual state than in the automated state. Also, these values for samples reported to be intermediate were higher in the manual state than in the automated state [13]. As the designed automatic measurement method uses image processing to measure the inhibition zone and has higher accuracy, this analysis indicated that laboratory technicians had a level of false measuring for determining the inhibition zone. In fact, the automated system reported a fraction of the strains that were resistant to antibiotics and vice versa; they were resistant to some strains when they were sensitive.
| Antibiotics | Manual | Automated | Total | ||||
|---|---|---|---|---|---|---|---|
| R | I | S | R | I | S | ||
| Ampicillin | 75 (50%) | 7 (4.6%) | 68 (45.3%) | 78 (52) | 7 (4.6) | 65 (43.3) | 150 |
| Gentamicin | 76 (50.6%) | 3 (2%) | 71 (47.3%) | 81 (54%) | 2 (1.3%) | 68 (45.3%) | 150 |
| Co-trimoxazole | 89 (59.3%) | 0 | 61 (40.6%) | 92 (61.3%) | 1 (0.6%) | 57 (38%) | 150 |
| Cefixime | 31 (20.6%) | 3 (2%) | 116 (77.3%) | 36 (24%) | 1 (0.6%) | 113 (75%) | 150 |
| Ciprofloxacin | 36 (24%) | 4 (2.6%) | 112 (74.6%) | 40 (26.6%) | 1 (0.6%) | 109 (72.6%) | 150 |
| R: Resistance; I: Intermediate; S: Sensitive | |||||||
Table 1: The results of inhibition zone measurement using the manual and automated methods.
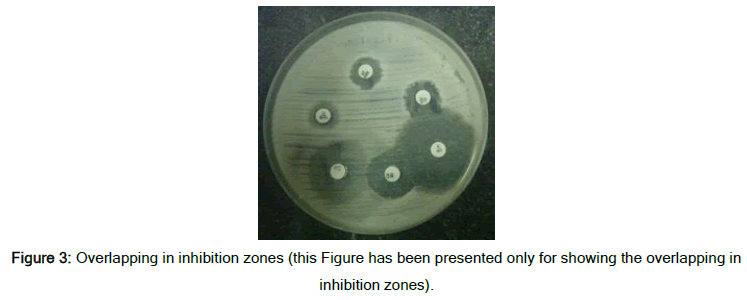
Figure 2 shows the frequency percentage of sensitivity and resistance of the samples in the two inhibition zone measurement methods. The difference in measurement and reporting of the results is visible in this chart. The error or inaccuracy in measurement results in the ineffectiveness of antibiotics that bacteria are resistant to, and this event increases the treatment period and imposes additional costs for the patients. The results show that the existence of an accurate diagnostic tool can have a very positive effect on laboratory reports and patient treatment [14]. This method's accuracy in measurement will be more critical when the inhibition zones found overlap and the measurement with a ruler was difficult for the lab technicians (Figure 3). However, the smart system designed here can calculate the inhibition zone accurately and consider distinguishing of occurred overlaps.
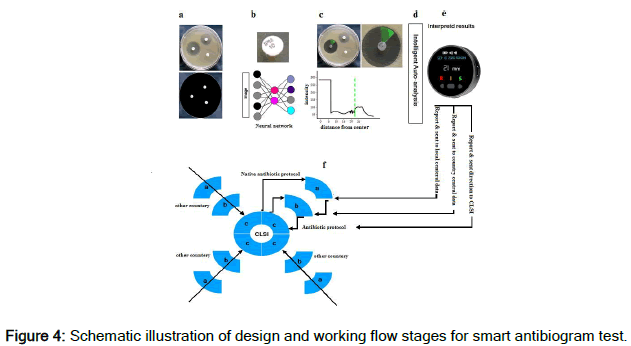
Figure 4 summarizes the laboratory tool design and the way of measurement, analysis, and reporting by the designed smart system. As demonstrated in Figure 4 (a), the photos taken by the device are scanned, and the antibiotic mapping will be performed [15]. In Figure 4 (b), the type of antibiotic is determined accurately based on the analysis of defined algorithms. In Figure 4 (c), the inhibition zone is measured with the highest accuracy. Figure 4 (d) analyzes the process for the data based on the inhibition zone related to each antibiotic compared to CLSI standard protocol. The results are automatically interpreted and reported (Figure 4 (e)) [16-18]. Figure 4 shows the relationship between the laboratory tool and the integrated system. In this system, the results reported by the laboratory are sent to a local data center on an online platform. Then, these data are sent to a central data center in each country, and finally, the information from all countries is sent to CLSI (Figure 4 (f)) for analysis of the results and consider decision for regarding the suggestion and guideline for antibiotic use in each country and even each city locally.
Table 2 compares the common traditional manual method and the smart type to do an antibiogram test. Here, we introduced a smart laboratory tool for antibiogram test with the ability to determine the exact antibiotic used, online updating of antibiotic consumption protocol, accurate measurement of the inhibition zone, smart distinguish of the inhibition zone based on the part of the zone in case of overlapping, online data analysis based on a predefined protocol and online recording and presenting the reports [19,20]. In Table 2, the summary of features and advantages of antibiogram tests in manual and automated conditions has been presented.
| Inhibition zone in the manual system |
| 1. Measuring inhibition zone manually. |
| 2. Manual report recording. |
| 3. Lack of reviewing and updating antibiotic use guidelines sometimes. |
| 4. Error in recognizing the antibiotic name. |
| 5. Error in measurement in case of inhibition zone interference. |
| 6. Error in measurement. |
| Inhibition zone in the automated system |
| 1. Measuring inhibition zone in a fully automated manner. |
| 2. Online report recording. |
| 3. Continuous automatic updating of antibiotic use guidelines. |
| 4. Accurate recognition of antibiotics based on the abbreviation. |
| 5. Smart reconstruction of inhibition zone in case of inhibition zone interference. |
| 6. Measurement based on artificial intelligence and lack of error in measurement. |
| 7. Result from analysis based on a predefined protocol in the internal memory. |
| 8. Online sending of results to the central laboratory database. |
| 9. Ability to send an online report to the patient and physician. |
| 10. Medium height estimation. |
| 11. Creation of a smart integrated system for antibiotic use management. |
| 12. Creation of a comprehensive database in line with epidemiologic studies. |
| 13. Predicting, prioritizing, and presenting a regional and a local guideline. |
| 14. Reviewing and revisiting the antibiotics used in antibiotic susceptibility testing monthly and annually. |
Table 2: The advantages and differences of the antibiogram test and inhibition zone measurement in manual and automatic systems.
Conclusion
Reasonable use of para-clinical diagnosis and timely and effective treatment can have a significant inhibitory role in the global phenomenon of antibiotic resistance. On the other hand, presenting accurate laboratory reports is essential based on several important aspects, including humanity, ethics, and economics, in a way that inaccurate diagnosis of sensitivity or resistance of the infection caused by a bacterium can increase hospitalization time for the patient in the hospital or the risk of hospital acquired infections. On the other hand, acquired infections resulting from a superficial infection and inadequate treatment of a severe and resistant infection in patients can pose serious risks to individuals, society, and the environment. Monitoring and controlling the emerging and resistant bacteria are significant steps in developing optimized strategies for combating these bacteria. Therefore, creating a compressive database for epidemiologic studies, measuring and determining the microbial resistance based on the analysis of the information from the smart and integrated system, monthly and annual reviewing of the antibiotics used in antibiograms, predicting, prioritizing, and presenting a guideline for regional and local antibiotic use independent of CLSI committee can have a significant role in controlling the antibiotic resistance. In order to better understand the role of the integrated global system for supervision and management recommended in this study for fighting antimicrobial resistance, there is a need for implementation of this study on a global scale and simultaneous participation of the health organizations in different countries.
Consent Statement/Ethical approval
Not required.
Declaration of competing interest
The authors declare that they have no known competing financial interests or personal relationships that could have appeared to influence the work reported in this research.
References
- Amatya N, Shrestha B, Lekhak B (2007) Etiological agents of bacteraemia and antibiotic susceptibility pattern in Kathmandu Model hospital. JNMA J Nepal Med Assoc 46:112-118
[Google Scholar] [PubMed]
- Aminov RI (2010) A brief history of the antibiotic era: Lessons learned and challenges for the future. Front Microbiol 1:134
[Crossref] [Google Scholar] [PubMed]
- Bahce YG, Acer O, Ozudogru O (2022) Evaluation of bacterial agents isolated from endotracheal aspirate cultures of COVID-19 general intensive care patients and their antibiotic resistance profiles compared to pre-pandemic conditions. Microb Pathog 164:105409
[Crossref] [Google Scholar] [PubMed]
- Bryksin AV, Matsumura I (2010) Rational design of a plasmid origin that replicates efficiently in both gram-positive and gram-negative bacteria. PloS one 5:13244
[Crossref] [Google Scholar] [PubMed]
- Chen A, Anderson J, Frater JL (2021) Preanalytical errors in a satellite stat laboratory: A Six Sigma analysis of seven years data. Clinica Chimica Acta 523:26-30
[Crossref] [Google Scholar] [PubMed]
- Cox G, Wright GD (2013) Intrinsic antibiotic resistance: Mechanisms, origins, challenges and solutions. Int J Med Microbiol 303:287-292
[Crossref] [Google Scholar] [PubMed]
- D’Costa VM, King CE, Kalan L, Morar M, Sung WW, et al. (2011) Antibiotic resistance is ancient. Nature 477:457-461
- Driehuis E, Kretzschmar K, Clevers H (2020) Establishment of patient derived cancer organoids for drug screening applications. Nat Protoc 15:3380-3409
[Crossref] [Google Scholar] [PubMed]
- Frieri M, Kumar K, Boutin A (2017) Antibiotic resistance. J Infect Public Health 10:369-378
[Crossref] [Google Scholar] [PubMed]
- Igbinosa E, Ogofure A, Beshiru A (2022) Evaluation of different agar media for the antibiotic susceptibility testing of some selected bacterial pathogens. J Basic Med Sci 8:1-2
- Landecker H (2016) Antibiotic resistance and the biology of history. Body Soc 22:19-52
[Crossref] [Google Scholar] [PubMed]
- Nadimpalli ML, Chan CW, Doron S (2021) Antibiotic resistance: A call to action to prevent the next epidemic of inequality. Nat Med 27:187-188
[Crossref] [Google Scholar] [PubMed]
- Nguyen AQ, Vu HP, Nguyen LN, Wang Q, Djordjevic SP, et al. (2021) Monitoring antibiotic resistance genes in wastewater treatment: Current strategies and future challenges. Sci Total Environ 783:146964
[Crossref] [Google Scholar] [PubMed]
- Pathania S, Singh PK (2021) Analysing FDA approved drugs for compliance of pharmacokinetic principles: should there be a critical screening parameter in drug designing protocols? Expert Opin Drug Metab Toxicol 17:351-354
[Crossref] [Google Scholar] [PubMed]
- Peyrani P, Mandell L, Torres A, Tillotson GS (2019) The burden of community acquired bacterial pneumonia in the era of antibiotic resistance. Expert Rev Respir Med 13:139-152
[Google Scholar] [PubMed]
- Plebani M, Aita A, Sciacovelli L (2021) Textbook of patient safety and clinical risk management. Springer, Cham 325-338
- Sakeena M, Bennett AA, McLachlan AJ (2018) Non-prescription sales of antimicrobial agents at community pharmacies in developing countries: a systematic review. Int J Antimicrob Agents 52:771-782
[Crossref] [Google Scholar] [PubMed]
- Shamsaddini A, Gillevet PM, Acharya C, Fagan A, Gavis E, et al. (2021) Impact of antibiotic resistance genes in gut microbiome of patients with cirrhosis. Gastroenterology 161:508-521
[Crossref] [Google Scholar] [PubMed]
- Shrestha KL, Pant ND, Bhandari R, Khatri S, Shrestha B, et al. (2016) Re-emergence of the susceptibility of the Salmonella spp. isolated from blood samples to conventional first line antibiotics. Antimicrob Resist Infect Control 5:1-5
[Crossref] [Google Scholar] [PubMed]
- Smieszek T, Pouwels KB, Dolk FCK, Smith DR, Hopkins S, et al. (2018) Potential for reducing inappropriate antibiotic prescribing in English primary care. J Antimicrob Chemother 73:236-243
[Crossref] [Google Scholar] [PubMed]

Open Access Journals
- Aquaculture & Veterinary Science
- Chemistry & Chemical Sciences
- Clinical Sciences
- Engineering
- General Science
- Genetics & Molecular Biology
- Health Care & Nursing
- Immunology & Microbiology
- Materials Science
- Mathematics & Physics
- Medical Sciences
- Neurology & Psychiatry
- Oncology & Cancer Science
- Pharmaceutical Sciences
