Competition of Fe3+ UV-Vis Absorption between Ascorbic Acid (AA) and Clofibric Acid (CA)
Hamada YZ
Hamada YZ*
Division of Natural and Mathematical Sciences, LeMoyne-Owen College, Memphis, TN 38126 USA.
Received date: September 27, 2016; Accepted date: September 31, 2016; Published date: November 07, 2016
Citation: Hamada YZ. Competition of Fe3+ UV-Vis Absorption between Ascorbic Acid (AA) and Clofibric Acid (CA). Electronic J Biol, S:2
Abstract
In this short communication, we are showing experimental evidence that Fe3+-Clofibric Acid (CA) complex has the ability to mediate the oxidation of a physiological substance, Ascorbic Acid (AA), using an established protocol. The change in UVVis absorption of AA at 265 nm was monitored (after 2 min) as a function of change of the concentration of CA. It also appeared that, over a period of 30 min and 60 min there was further decrease in the overall absorption of the ferric-clofibrate-ascorbate complexes. Further detailed studies are needed in this area.
Keywords
Fe3+; Clofibric Acid (CA); Ascorbic Acid (AA); UV-Vis absorption spectroscopy.
1. Introduction
This short commentary is a part of the special issue of the role of metal ions in biological systems in particular those of the first series of the transition metals in the periodic table. Many researchers have studied the decomposition of AA in the presence of many metal ions which lead to the formation of a polymeric metal oxalate species with peculiar structural features [1]. Others studied the kinetic of AA oxidation using different chemicals and/or metal ions [2-7]. The nature of AA transformation depends on two factors, (1) pH-values, and (2) the type of metal ion involved as it was reviewed extensively by Davies [8].
For example, Martell and Khan have studied the kinetics of the decomposition of AA with many metal complexes such as the cupric (Cu2+), the ferric (Fe3+), the vanadyl (VO2+), and the uranyl (UO2 2+) ions with many numbers of chelating ligands such as 1,10-phnanthroline, ethylene diamine tetra-acetic acid (EDTA), trans-1,2-diaminocyclohexametetraacetic acid (CDTA), and di-ethylene-tri-amine-penta-acetic acid (DTPA) among other ligands [4-7]. The most comprehensive metal ion stability constant data base by Martell and Smith published by National Institute of Standard and Technology (NIST) does not contain any data for the reaction of CA with any metal ion [9]. The lack of detailed studies (theoretical or otherwise experimental, in vitro or in vivo) for the reaction of CA with metal ions was one of the reasons that prompted us to take the initiative to study the reactions of CA with a many of metal ions [10,11].
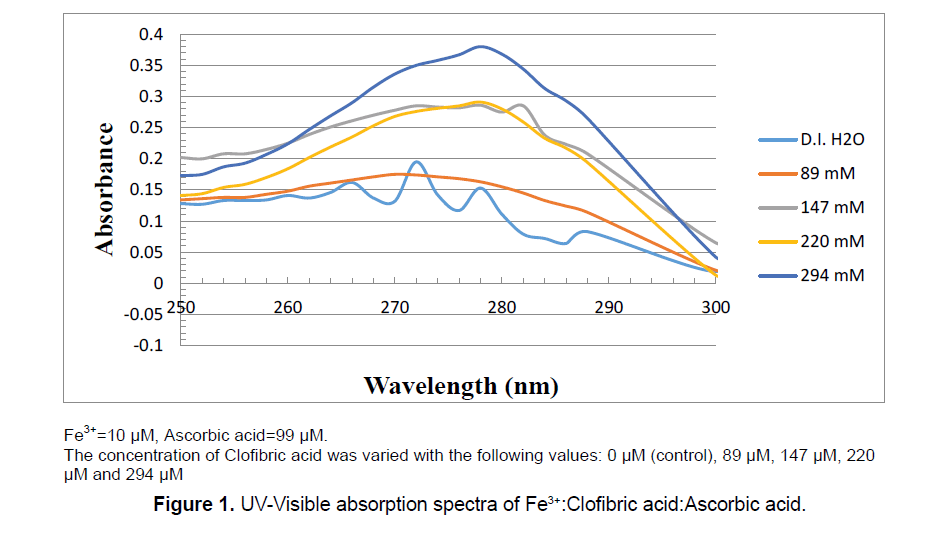
Here, we are showing a very simple UV-Vis experimental setup (in vitro) in which we have scanned the mixture of Fe3+:CA:AA from 250 nm to 350 nm. The reason for the choice of this scanning window is the fact that AA, CA and Fe3+ do not have measurable absorption beyond these window (near UV-Vis, Visible, nor the far UV-Vis, nor the near IR region of the spectrum) Also, we have measured the UV-Vis spectra at a constant value of 265 nm which is the maximum value for ascorbic acid absorption.
2. Methods
2.1 Chemicals
Clofibric acid (CA) [C10H11ClO3] Formula weight (F. Wt.)=214.6 gmol-1 and iron nitrate nona-hydrate [Fe (NO3)3ÃÆâÃâââ¬âÃâÃÂ9H2O] F. Wt.=404.0 gmol-1 were from Sigma Aldrich (St. Louis, MO 63178 USA). L(+)Ascorbic Acid (AA) [C6H8O6] F. Wt.=176.13 gmol-1 was purchased from Acros (New Jersey, USA). All solutions were prepared using doubly deionized water (D.I. H2O). All glassware (beakers, volumetric flasks and cuvettes) were soaked in acid bath for extended period of time. Glassware was washed three times with D.I. H2O before any use or any solution preparation.
2.2 UV-Vis spectroscopy
All UV-Vis spectroscopic measurements were conducted using a T60 high-performance spectrophotometer in connection with UVWIN software version 5.0, (Advanced ChemTech, Louisville, KY). Samples were prepared in D.I. H2O at 25°C. The UV-Vis spectra were scanned from 250 nm to 350 nm in quartz cuvettes. The concentration of the Fe3+ was fixed at 10 μM which is =10.0 × 10⁻⁶ mol.L-1. The concentration of AA was fixed at 99 μM which is =99.0 × 10⁻⁶ mol.L-1. The concentration of CA was variable as shown in Table 1 and Figure 1.
To reach the above mentioned concentrations, the three components (Fe3+, AA and CA) were mixed in the following order: To a series of five equal volumes 250 mL volumetric flasks; 10 mL, 20 mL, 30 mL, 40 mL and 50 mL of 1.835 × 10⁻³ mol.L-1 of CA aqueous solutions were added first followed by the addition of 50 μL of 50 mM Fe(NO3)3 solution to each volumetric flask, followed finally, with the addition of 10 mL of AA to each volumetric flask.
3. Results
| Vol. of CA (mL) | Concentration of Clofibric acid (μM) | Absorbance at 265 nm after 2 min (taken 3 times) |
|---|---|---|
| 10.0 mL | 89 μΜ | 0.247 ± 0.011 |
| 20.0 mL | 147 μΜ | 0.231 ± 0.003 |
| 30.0 mL | 220 μΜ | 0.320 ± 0.003 |
| 40.0 mL | 294 μΜ | 0.342 ± 0.001 |
| 50 mL | 366 μΜ | 0.392 ± 0.001 |
| To reach the Fe(NO3)3 concentration of (10 μM) and L-AA concentration of (99 μM); 50 μL of 50 mM Fe(NO3)3 solution was added to each volumetric flask, followed by the addition of 10 mL of 2.5 mM AA to each volumetric flask | ||
Table 1: Detailed amounts of every chemical added to the reaction mixture. Absorption values of Ascorbic Acid (AA) were taken at 265 nm with the change of the concentration of Clofibric acid.
The UV-Vis spectra scans were collected instantaneously (after 2 min, this is the fastest time we can mix and arrange all cuvettes in the UV-Vis spectrophotometer compartment) by mixing the above mentioned reagents in the order mentioned above. Table 1 shows the detailed amounts of every chemical added to the reaction mixture. Absorption values of the spectra were scanned from 250 nm to 350 nm. To reach the Fe(NO3)3 concentration of (10 μM) and L-AA concentration of (99 μM); 50 μL of 50 mM Fe(NO3)3 solution was added to each volumetric flask, followed by the addition of 10 mL of 2.5 mM AA to each volumetric flask. All solutions were freshly prepared prior to the experiment and were incubated at room temperature.
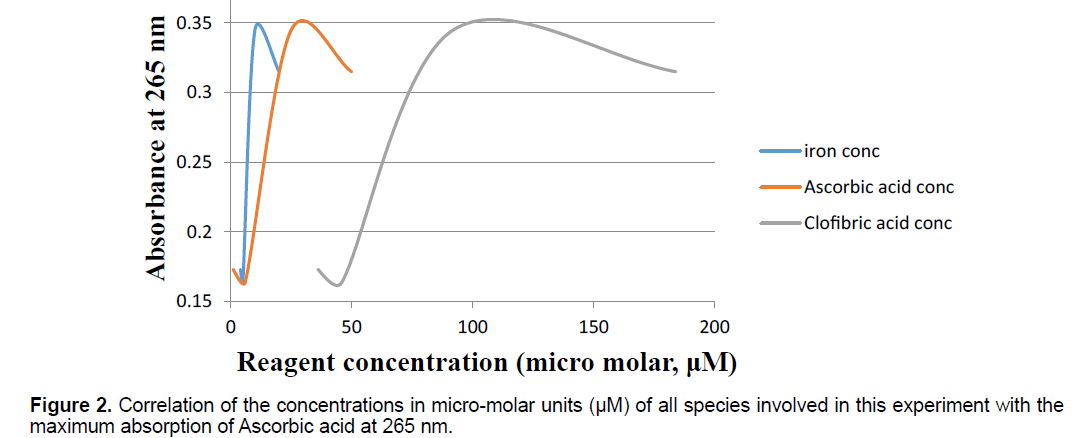
In another UV-Vis spectrum setup, the UV-Vis spectrum was measured at a constant value of 265 nm (this is the maximum value for ascorbic acid absorption). The ability of the iron complexes of CA to mediate the oxidation of a physiological substance, AA, was further examined by observing the increase in the absorption value as a function of concentration as shown in Figure 2. Figure 2 shows the changes in the concentrations of L-AA, that of the ferric ion solution Fe3+ and that of CA were as a function of the Absorbance at the constant value of 265 nm. Both of the above mentioned UV-Vis experiments were done by using quartz cuvettes with optical path length of 1 cm.
Table 2 is showing the correlations of the net absorbance of the reaction mixture over an hour after mixing. After 2, 30 and 60 min, respectively the values of the overall reaction mixtures (AA, Fe3+ and CA) appeared to be decreasing over time. This indicates the decomposition of the formed complexes, or perhaps the loss of the AA to its absorption value due to its oxidation.
| CA concentration (μΜ) | Absorbance (after 2 min, taken 3 times) | After 30 min | After 60 min | |
|---|---|---|---|---|
| 1 | 89 | 0.247 ± 0.011 | 0.200 | 0.192 |
| 2 | 147 | 0.231 ± 0.003 | 0.229 | 0.216 |
| 3 | 220 | 0.320 ± 0.003 | 0.317 | 0.303 |
| 4 | 294 | 0.342 ± 0.001 | 0.336 | 0.325 |
| 5 | 366 | 0.392 ± 0.001 | 0.377 | 0.366 |
| The absorbance were measured at 2 min, after 30 min passed and after 60 min passed on solution preparations | ||||
Table 2: The absorbance of all reagents mixed in this experiment at 265 nm; the absorbance values are decreasing over time.
We have shown in a separate study, in the special issue of the electronic journal of biology (eJBio), that the maximum absorption of CA appeared at the range of 275 nm to 278 nm as shown in Figure 1. Also, the maximum absorption of Fe3+ appeared at the range of 300 nm to 305 nm. It is known from literature that the maximum absorption of AA appeared at 265. For that above mentioned reasons, there is a clear overlap between the absorptions of both AA and that of CA. Further kinetic and detailed experimental setups are needed in this area to further monitor the decomposition of ascorbic acid.
4. Discussion
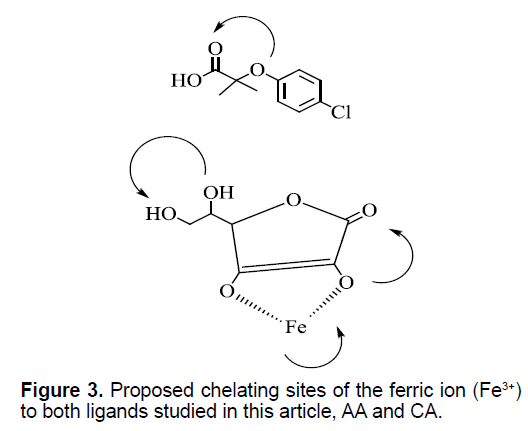
Herein, we are showing in Figure 3 the predicted position of binging of Fe3+ to both AA and that of CA. the curved arrows are showing the possible chelating sites. There are three chelating sites on AA vs. one chelating site on CA. The change of the net and overall UV-Vis absorption of (Fe3+:CA:AA) reaction mixture was scanned and monitored from 250 nm to 350 nm. Also in a separate experiment, we monitored the changes of the absorbance(s) with the changes in reagent’s concentrations at the maximum value of 265 nm (265 nm is maximum absorption of that of AA). We are showing a new experimental evidence (in vitro) that there is tangible changes in the Ultraviolet-Visible absorption spectroscopy for the reaction mixture of CA-Fe3+ and the biologically known AA ligand. One might predict form the decrease in the net absorption of the reaction mixture as over time as shown in Figure 3 the decomposition of AA to de-hydroascorbate as it is known as one of its decomposition by products. Figure 3 is showing the possibilities of the binding of Fe3+ with both AA and CA ligands. Further experimental (both in vitro and in vivo works) and theoretical calculations are needed in this area which are underway in our lab to enhance the understanding of this reaction system.
5. Acknowledgement
This work was supported from NSF under Grant # HRD-1332459. Special thanks to Dr. Mostafa Z Badr of the Division of Pharmacology & Toxicology, School of Pharmacy, University of Missouri- Kansas City for the idea of the project and helpful suggestions. Also, we would like to thank Hasan Hamada for reading the manuscript.
References
- Orioli P, Bruni B, DiVarira M, et al. (2002). Decomposition of ascorbic acid in the presence of cadmium ions leads to formation of a polymeric cadmium oxalate species with peculiar structural features. Inorg Chem. 41: 4312-4314.
- Burgess AE, Davidson JC. (2014). Kinetics of the rapid reaction between iodine and ascorbic acid in aqueous solution using UV-Visible absorbance and titration by an iodine clock. J Chem Ed. 91: 300-304.
- Pelizzetti E, Mentasti E, Pramauro E. (1976). Kinetics and mechanism of the oxidation of ascorbic acid by tris(1,10-phenanthroline)iron(III) and its derivatives in aqueous acidic perchlorate media. Inorg Chem. 15: 2898-2900.
- Taqui Khan MM, Martell AE. (1967). Metal ion and metal chelate catalyzed oxidation of ascorbic acid by molecular oxygen. I. Cupric and ferric ion catalyzed oxidation. J Am Chem Soc. 89: 4176-4185.
- Taqui Khan MM, Martell AE. (1968). Kinetics of metal ion and metal chelate catalyzed oxidation of ascorbic acid. III. Vanadyl ion catalyzed oxidation. J Am Chem Soc. 90: 6011-6017.
- Taqui Khan MM, Martell AE. (1969). Kinetics of metal ion and metal chelate catalyzed oxidation of ascorbic acid. IV. Uranyl ion catalyzed oxidation. J Am Chem Soc. 91: 4668-4672.
- Taqui Khan MM, Shukla RS. (1991). Kinetic and spectroscopic study of the formation of an intermediate ruthenium(III) ascorbate complex in the oxidation of L-ascorbic acid. Polyhedron. 10: 2711-2715.
- Davies MB. (1992). Reactions of L-ascorbic acid with transition metal complexes. Polyhedron. 11: 285-321.
- Martell AE, Smith RM, Motekaitis RJ. (2001). Critical Stability Constants Database, Version 6.0, NIST, Texas A & M University, College Station, TX, USA.
- Hamada YZ, Badr MZ, Hayes J, et al. (2016). Ternary metal-hydroxo chelate of Cr3+ with Clofibric acid (CA): A peroxisome proliferator-activated receptors-alpha (PPARα) ligand. J Heavy Met Toxicity Dis. 1: 1-8.
- Hamada YZ, Badr MZ, Darboe HA. (2016). Copper-hydroxo chelates of clofibric acid (CA). Reaction of Cu2+ with CA. J Heavy Met Toxicity Dis. 1: 12.

Open Access Journals
- Aquaculture & Veterinary Science
- Chemistry & Chemical Sciences
- Clinical Sciences
- Engineering
- General Science
- Genetics & Molecular Biology
- Health Care & Nursing
- Immunology & Microbiology
- Materials Science
- Mathematics & Physics
- Medical Sciences
- Neurology & Psychiatry
- Oncology & Cancer Science
- Pharmaceutical Sciences


