Clofibric Acid, A Peroxisome Proliferator-Activated Receptor Alpha Agonist, forms a Ternary Complex with the Ferric Iron
Yahia Z Hamada, Samid Rehan, Jasmine Scott
Division of Natural and Mathematical Sciences, LeMoyne-Owen College, 807 Walker Avenue, Memphis, TN 38126 USA.
- Corresponding Author:
- Yahia Z Hamada
Division of Natural and Mathematical Sciences
LeMoyne-Owen College, 807 Walker Avenue
Memphis, TN 38126 USA
Tel: 1(901) 435-1392
Fax: 1(901) 435-1424
E-mail: Yahia_hamada@loc.edu
Received date: September 15, 2016; Accepted date: January 06, 2017; Published date: January 13, 2017
Citation: Hamada YZ, Rehan S, Scott J. Clofibric Acid, A Peroxisome Proliferator-Activated Receptor Alpha Agonist, forms a Ternary Complex with the Ferric Iron. Electronic J Biol, S:2
Abstract
It has been proposed that the antihypelipidemic and antihypercholesteremic effect of fibrates is a result of activating the peroxisome proliferator-activated receptor alpha (PPARα), leading to the enhancement of lipid catabolism. Since high iron status has been linked to the increased risk of heart disease, and oxidative stress has been implicated in the etiology of atherosclerosis, this study was undertaken to investigate whether prototypic fibrate, clofibric acid (CA) complexes with ferric iron (Fe3+) and determine the nature of the formed iron complexes. Elemental analysis, potentiometric titrations, UV-Vis absorption spectroscopy and ICPMS show that CA binds Fe3+, form a ternary complex, in aqueous solutions at 25ºC. Because CA complexes with copper and prevents copperinduced oxidation reactions and iron chelators blocked ironinduced inflammatory responses, we propose that binding iron by fibrates may contribute to the antiatherogenic effect of these drugs. Binding iron may also be responsible for anemia reported in patients receiving members of this class of PPARα agonists.
Keywords
Clofibric acid; Fe3+; Elemental analysis; Potentiometric titrations; UV-Vis absorption spectroscopy; ICPMS.
Introduction
Peroxisome proliferator-activated receptors (PPARs) are members of the steroid receptor superfamily [1,2]. To date, there are three known receptors, namely PPARα, β / δ and γ. These receptors regulate multiple genes involved in energy production, glucose and lipid metabolism and influence the pathology of numerous diseases including obesity, diabetes, atherosclerosis, inflammation and cancer [2]. PPARs are activated by a vast number of compounds including synthetic drugs such as the clofibrate and anti-diabetic thiazoldinediones, polyunsaturated fatty acids, and a number of eicosanoids, including prostaglandins, lipoxygenase products and oxidized low density lipoprotein [2].
It has been reported that a beneficial cardiovascular effect in response to the PPARα agonists, fibrates may result from their ability to reduce serum triglycerides and cholesterol [3]. However, more recent studies demonstrate that the reported pharmacological effects of these chemicals may at least be partially caused through the inhibition of oxidative stress [4,5]. Although the antioxidant effect of fibrates may be due, in part, to enhancing cellular antioxidant defense mechanisms, it remains plausible that fibrates act directly to diminish or halt oxidative reactions, by binding free iron from the labile iron pool [4-6]. It is indeed intriguing that patients treated with clofibrate suffer from diminished hemoglobin levels, suggesting that this class of PPARα agonists interferes with iron homeostasis [7].
Studies have shown that clofibric acid binds to metals such as copper, and reduces copper-induced oxidation reactions [3,8]. In addition, it has been found that ferric iron induced an inflammatory response in pre-adipocytes in vitro, an effect which was blocked by co-incubation with iron chelators [9]. These findings along with the fact that high iron status has been implicated in the increased risk of heart disease, and that anemia has been observed in response to treatment with clofibrate, both in humans and experimental animals, have prompted us to investigate if clofibric acid binds to iron (III) and the nature of such interaction Scheme 1 [10].

Scheme 1: Structural formula of clofibric acid (CA), or [2-(4-chlorophenoxy)-2-methylpropanoic acid] (Chemical formula C10H11ClO3).
Materials and Methods
Chemicals
CA [C10H11ClO3], and iron nitrate nona-hydrate [Fe (NO3)3●9H2O] were from Sigma Aldrich (St. Louis, MO 63178 USA). Potassium hydrogen phthalate and NaOH were purchased from Fisher Chemical Co (Fair Lawn, NJ 07410 USA).
Potentiometry
In all metal-ligand potentiometric titrations, the NaOH solution, in carbonate-free H2O, as described elsewhere was used [11-14]. The NaOH solutions were standardized using primary standard potassium hydrogen phthalate (KHP), using 0.2% phenolphthalein in 90% ethanol. Typically, thirteen-fifteen runs were carried out to standardize the NaOH solution.
In a typical titration, Fe3+ solution was added to the CA solution. To adjust the ionic strength of the solution to a constant 0.1 M, the appropriate amount of 1.0 M NaNO3 was added. The total volume of the final titration solution was 100 mL. The final concentration of the Fe3+ solution titrated was 5.0 × 10⁻⁴ M. Before each titration, the solution mixtures were stirred for 25 min to reach equilibrium. The NaOH titrant was added in 100 μL increments with continuous stirring. The time intervals between the additions of NaOH were set at 5 min, which was sufficient to get the pH stabilized and reach a state of equilibrium. The starting pH was in the range of 3-4 and the final pH was in the range of 10-11. All titrations were conducted at room temperature.
UV-vis spectroscopy
All UV-Vis spectroscopic measurements were conducted using a T60 high-performance spectrophotometer in connection with UVWIN software version 5.0, (Advanced ChemTech, Louisville, KY). Samples were prepared in deionized water at 25ºC. The UV-Vis spectrum was scanned from 250 to 700 nm using quartz cuvettes with optical path length of 1 cm, using a reference cuvette filled with deionized water as the control. The concentration of the metal was 5.93 × 10⁻⁴ mol.L-1. The UV-Vis spectra were collected at pH 3.50 immediately after mixing the reagents.
Fe3+-CA complex preparation
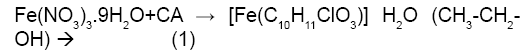
Iron nitrate nonahydrate [Fe (NO3)3.9 H2O] (1.924 g; 4.76 mmol) was added to CA (1.037 g; 4.83 mmol), followed by the addition of 7.50 mL absolute ethanol. A deep reddish color of the iron complex was instantaneously observed. The ethanol solution mixture was refluxed for 35 min. The reaction mixture was allowed to stand to cool for 7 h. 1.499 g of amorphous product was collected from the solution. The complex was characterized by UV-Vis, potentiometry, mass spectrometry and elemental analyses as well as melting point.
Mass spectrometry optimization
Mass spectrometer (3200 QTRAP LC-MS/MS system, AB Sciex) was optimized for detection of clofibric acid and its analog ferric clofibric acid. Mass spectrometry data of each compound was first acquired in full scan mode from the range of 50 Dalton to 500 Da to identify their precursor ions. The most suitable proton adduct in an electrospray ionization [M-H]+ precursor ions was determined for clofibric acid mass to charge ratio (m/z) 214.8 amu and fragment at (m/z) 113 and Ferric clofibric acid (m/z) at 333.3 amu in [M-H]+ with low intensity, but its major fragments were observed prominently (m/z) at 212.8 and 112.9. These precursor ions were optimized by setting the curtain gas (15 psi), declustering potential (58 V), ion spray voltage (-4300 V) and source gas 1 (40 psi) for ferric clofibric acid. Similarly, curtain gas (12 psi), ion spray voltage (-4500 V) and source gas 1 (45 psi) were optimized for clofibric acid.
Elemental analysis
Elemental analyses of the prepared complexes were sent to EAI-Elemental Analysis, Inc. Lexington, KY. Typical C H O weight percentages were conducted by combustion methods as indicated by EAI, Inc. The Cl weight percent was determined by colorimetric titrations. The Fe weight percent was determined by Inductively Coupled Plasma Mass Spectroscopy.
Statistics
Standard statistical analyses of the data were conducted using Excel software. Typical data set was treated with Excel software for the summation, average, standard deviation, t-test and q-test.
Results and Discussion
Recent studies have demonstrated that the beneficial cardiovascular effects of the PPARα agonists fibrates may be partially achieved through the inhibition of systemic inflammation and oxidative stress, through unknown mechanisms [4,5]. The antioxidant effect of these drugs may be due, in part, to enhancing cellular antioxidant defense mechanisms [4,5]. However, patient iron status has been implicated in the risk of heart disease, and ferric iron-induced inflammation in pre-adipocytes is blocked by iron chelators [9,10].
Dual effect of clofibrate on iron
As free iron (Fe+2/Fe+3 from the labile iron pool) is known to catalyze the production of highly reactive oxidants through the Fenton/Haber-Weiss reaction cycle, the above findings suggest that CA confers their protective antiatherogenic effect, at least in part, through diminishing or halting oxidative reactions by sequestering free iron [6].
In contrast to the fibrate-induced beneficial antioxidant effect resulting from binding free iron, disturbing iron homeostasis by fibrates may, on the other hand, explain the occurrence of anemia which develops in patients treated with clofibrate [7]. Similarly, rats fed a diet containing 0.5% clofibrate for 42 days exhibited comparable decline in hemoglobin, as well as a significant decrease in serum iron levels [15]. Reducing hemoglobin levels is expected to compromise the ability of body organs to receive adequate oxygen necessary for their normal functions. In addition, many important enzymes, such as cytochrome P450, peroxisomal oxidases and mitochondrial enzymes, are iron-containing proteins where reduced serum iron is expected to negatively impact their activities, diminishing the ability of the body to metabolize endogenous elements of intermediary metabolism and xenobiotics.
Thus, we hypothesized that both the pharmacological as well as the toxicological effects of clofibrates may rationally be explained through a common mechanism of action, namely binding free iron. Consequently, the current study aimed to examine if clofibric acid indeed is capable of binding to iron and to characterize the nature of putative CA-iron molecule(s).
Detailed literature review revealed a very limited number of publications on the interaction of CA with metal ions, especially in aqueous solutions [16,17]. Although Ghauch et al. [17] have studied the effect of CA on metallic iron (Fe°) and iron plated surfaces, there are no published reports to date on the interaction between CA and ionic iron in aqueous solutions. Moncol et al. reported, however, the crystal structures and the spectral properties (UV-Vis, EPR) for both the bis Cu(CA)2 and the dimeric (Cu)2:CA complexes, from methanolic solvent [15].
Chemistry of clofibric acid and iron complex Potentiometric titrations of free CA and free Fe3+
Potentiometric titration experiments of free CA yielded a pKa value of 4.32 ± 0.06 at 25°C, 0.1 M NaNO3. CA releases a single proton due to the fact that CA has a sole titratable functional group; a carboxylic acid group. To the best of our knowledge The Fe/CA data presented in the current report are novel and are not reported in the NIST standard reference database of critically selected stability constants of metal complexes.
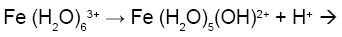
Figure 1a is the potentiometric titration graph of free Fe3+. In this graph the x-axis shows the volume of added titrant, while the y-axis shows the observed pH-values. After converting the volume of titrant into number of equivalents of titrant, it is clear that the trivalent Fe3+ releases a net of three proton equivalents into the aqueous solutions (Figure 1b). This is due to Fe3+ ion hydrolysis. The term metal ion hydrolysis is defined in equations 2-4 [18-24]. The number of equivalents is defined as the number of mmol of added titrant per number of mmol of iron ion present in solution.

Figure 1: Potentiometric titration curves of free Fe3+ in 0.1M NaNO3, 25°C. Three plots are presented to show data consistency. The volume of added titrant in (a) was converted to the number of equivalents of added titrant which is defined as the number of mmol of added titrant per number of mmol of Fe3+ ion. Slopes in (b) are generated by taking the first derivatives of the measured pH-values (pHobs).
 (2)
(2)
 (3)
(3)
 (4)
(4)
Potentiometric titrations of Fe3+ with CA in 1:1, 1:2 and 1:3 ratios
Figure 2 shows Fe3+:CA titration in 1:1 molar ratio. The location of the major inflection point indicates how many proton equivalents were released. The plots in Figure 2 show that approximately three proton equivalents were released from the Fe3+:CA reaction mixture; one proton from the carboxylate of the CA and the other two from two aqua ligands on the iron. This indicates that the major complex formed is the ternary [Fe3+(CA) (OH-)2]0 complex.

Figure 2: Potentiometric titrations of Fe3+:CA in 1:1 ratio, 0.1 M NaNO3, 25°C.
Figure 3 show five proton equivalents were released from this Fe3+:CA reaction mixture. This indicates that major complex formed is also the ternary [Fe3+(CA) (OH-)3]1-. This complex accounts for the release of a proton from the carboxylate of CA, three from the aqua-ligands on the iron and the fifth from an extra free mole of CA.

Figure 3: Potentiometric titrations of Fe3+:CA in the 1:2 reaction system that covers the entire pH range, 0.1 M NaNO3, 25°C.
Figure 4a shows the potentiometric titrations for Fe3+:CA in 1:3 ratio. The average proton equivalents of these three experiments appeared to be (6.27 ± 0.31). Figure 4b shows the linear regression of the relation between the pH values and the potential in milli-volts (mV) for the Fe3+:clofibric acid in 1:3 ratio. Similar linear regressions were plotted for the 1:1 and the 1:2 reaction ratios in which the pH values were plotted versus the potential in mV. Figure 4b shows that the potential of all Fe3+-CA complexes formed covers the span of 462 mV (from +231 mV to -231 mV). The slope of this linear regression is -57.91, which is in agreement with the Nernst equation [18-22].

Figure 4: Potentiometric titrations of Fe3+:CA in 1:3 ratios, 0.1 M NaNO3, 25°C. (a) Is the correlation of pH versus number of added equivalents, while (b) is the correlation of pH versus potential in mV.
UV-Vis spectroscopy
Figure 5 shows the UV-Vis absorption spectra of free Fe3+, free CA, and Fe3+:CA reaction mixture in 1:1.7 molar ratio. The maximum absorption peak (λmax) for the free CA appeared at 280 nm, λmax for the free Fe3+ appeared at 300 nm, while that for the reaction mixture appeared at 350 nm, providing an unequivocal proof that there is an instantaneous reaction between Fe3+ and CA in aqueous solutions at room temperature.

Figure 5: UV-Vis absorption spectra of DI H2O as the baseline (blue), free Fe3+(red), free CA (green) and Fe3+:CA reaction mixture in 1:1.7 molar ratio (purple) in aqueous solution at room temprature. The spectra show that the Fe3+ is reacted with CA to from the Fe3+-CA complex(es). Ferric iron concentration was 5.93 × 10⁻⁴ mol.L-1.
Mass spectrometry
Figures 6 and 7 show the mass spectra for the free CA and for the Fe3+:CA in 1:1 ratio. All peaks were summarized in Tables 3. In Figure 6 the two major peaks were the molecular ion peak at 213.0 and the aromatic fragment at 112.9. In Figure 7, the molecular ion peak can also be observed at 212.8 in addition to a series of Fe3+-CA complexes. The proposed Fe-CA complexes are shown in Table 3. The mass spectra showed the formation of the proposed iron-CA-ternary complex; i.e., the [Fe(CA) (OH)]+ with the appearance of a peak at 283.2. Scheme 2 also shows the sequential de-protonation of the formed complexes.

Figure 6: Mass spectra of free CA (ICPMS).

Figure 7: Mass spectra of Fe3+:CA (ICPMS) in 1:1 ratio.
| Parameters | Fe(NO3)3.9H2O | C10H11ClO3 | [Fe(C10H11ClO3)] H2O.(ethanol) |
|---|---|---|---|
| Molecular weight (g/mol) | 404 | 214.6 | 334.35 |
| Mass (g) | 1.924 | 1.037 | 1.499 |
| mmol | 4.76 | 4.83 | 4.48 |
| Melting point (°C) | 47.2 ± 1.0 | 123.1 ± 1.0 | 101.0 ± 1.0 |
Table 1: Stoichiometric amounts and melting points of the Fe3+-CA complex.
| Fe3+:CA molar ratios | 1:1 | 1:2 | 1:3 |
|---|---|---|---|
| Number of titration reactions | 4 | 4 | 3 |
| Number of proton equivalents± SD | 3.49 ± 0.31 | 5.24 ± 0.34 | 6.27 ± 0.31 |
Table 2: Potentiometric titrations of the Fe3+:CA mixture in various molar ratios.
| Fe-CA Complexes | Molecular Weight | Remarks |
|---|---|---|
| Fe(CA) | 265.3 | |
| Fe(CA) (OH) | 283.2 | Observed in Potentiometric |
| Fe(CA) (OH)2 | 302 | Observed in Potentiometric |
| Fe(CA) (OH)3 | 319 | Observed in Potentiometric |
| Fe(CA)2 | 479 | Matches Elemental Analysis |
| Fe(CA)3 | 691 | Matches Elemental Analysis |
| Fe(CA) (H2O) | 283 | |
| Fe(CA) (H2O)2 | 301 | |
| Fe(CA) (H2O)3 | 319 | |
| Fe(CA) (H2O)4 | 337 | |
| Fe(CA) (OH) N2 | 311.3 | We suggest that there are N2 in the sample that is picked up by the mass spec. |
| Fe(CA) (OH) N2(N) | 325.0 | These complexes are different by 14 the Atomic mass of N |
| Fe(CA) (OH) N2(N) | 339.1 | |
| Fe(CA) (OH) N2(N) | 353.2 | |
| (CA)2 | 427.2 | |
| CA | 212.8 | |
| 112.8 |
Table 3: Summary of the mass spectrometry peaks.

Scheme 2: The proposed aqueous solution structures for the metal-clofibrate ternary complexes of Fe3+.
Elemental analysis
The elemental analysis showed the formation of a mixture of Fe(CA) complexes. Table 4 is the summary of C H O Cl and Fe weight percentages. These percentages agree with the proposed ternary, bis- and tris-Fe(CA) complexes, namely [Fe(CA) (OH)], Fe(CA)2 and Fe(CA)3. To sort out what are the predominant species, a detailed speciation study along with the stability constants measurements of these ferric iron complexes need to be assessed, which is underway in our laboratory.
| Proposed compounds and weight % | Molecular Mass (g/mol) | C | H | O | Cl | Fe |
|---|---|---|---|---|---|---|
| % Found by EAI, Inc. | 21.40% | 2.89% | 24.16% | 11.23% | 8.86% | |
| [Fe(CA) (OH)] H2O (CH3-CH2-OH) | 334 | 42% | 3.3% | 28% | 10.6% | 16.7% |
| [Fe(CA) (OH)]2 n H2O n (CH3-CH2-OH) | 566 | 42% | 3.5% | 17.0% | 12.5 | 19.7% |
| Fe(CA)2 | 479 | 25.1% | 2.1% | 20% | 7.4% | 13.9% |
| Fe(CA)3 | 691 | 17.4% | 1.5% | 21% | 5.1% | 8.1 % |
Table 4: Summary of the elemental analysis data.
The literature evidence overwhelmingly suggests a lack of research on the interaction between CA and free iron [20]. In this study, based on the number of protons released into the solution, we propose the formation of ternary hydroxoclofibrate iron complexes namely [Fe3+ (clofibrate-) (OH-)3]1-, according to the description in Scheme 2. The data presented in the current report are novel and valuable due to the identification of the ternary or mixed Fe-CA-hydroxo complexes in aqueous solutions at room temperature. We were able to identify a series of Fe3+-CA complexes in which they carry a net charges of (2+), (1+), (0) and (1- ). Elemental analysis and ICPMS show the formation of the bis-and tris-complexes namely Fe (CA)2 and Fe(CA)3 in addition to the series of Fe3+-CA complexes shown in Scheme 2. We propose that both the pharmacological as well as the toxicological effects of clofibrates are mediated through a common mechanism of action, namely binding free iron. Our results provide a rational basis for the antioxidant mechanism proposed for fibrates; inhibiting iron-mediated oxidative reactions by binding free iron. Our data also explain the underlying reason for the observed fibrate-induced anemia in patients undergoing treatment with members of this class of PPARα agonists.
Acknowledgement
This work was supported from NSF under Grant # HRD- 1332459. Special thanks to the Division of Natural and Mathematical Sciences especially, Dr. Sherry Painter of LOC for useful suggestions on the manuscript and to Dr. Mostafa Z Badr of the Division of Pharmacology & Toxicology, School of Pharmacy, University of Missouri-Kansas City (UMKC) also we would like to thank Dr. Ravinder Earla at UMKC for performing the Mass Spec analysis.
References
- Issemann I, Green S. (1990). Activation of member of the steroid hormone receptor superfamily by peroxisome proliferators. Nature 347: 645-650.
- Youssef J, Badr M. (2013). Peroxisome proliferator-activated receptors: Discovery and recent Advances. Springer, New York, USA.
- Vázquez M, Vázquez M, Merlos M, Adzet T, et al. (1996). Decreased susceptibility to copper-induced oxidation of ratlipoproteins after fibrate treatment: influence of fatty acid composition. Br J Pharmacol. 117: 1155-1162.
- Ibarra-Lara L, Hong E, Soria-Castro E, et al. (2012). Clofibrate PPARα activation reduces oxidative stress and improves ultrastructure and ventricular hemodynamics in no-flow myocardial ischemia. J Cadiovasc Pharmacol. 60: 323-34.
- Gelosa P, Banfi C, Gianella A, et al. (2010). Peroxisome proliferator-activated receptor alpha agonism prevents renal damage and the oxidative stress and inflammatory processes affecting the brains of stroke-prone rats. J Pharmacol Exp Ther. 335: 324-331.
- Kruszewski M. (2003). Labile iron pool: The main determinant of cellular response to oxidative stress. Mutat Res. 531: 81-92.
- Schrefer J. (2001). Mosby’s GenRx, 11th edition, Mosby, St. Louis, MO.
- Melnik M, Koman M, Hudecova D, et al. (2000). Spectral and magnetic properties and bioactivity of copper (II) clofibrate. Inorganica Chimica Acta. 308: 1-7.
- Westerink J, Olijhoek JK, Koppen A, et al. (2013).The relation between body iron stores and adipose tissue function in patients with manifest vascular disease. Eur J Clin Invest. 43: 1240-1249.
- Bonomo Lde F, Silva M, Oliveira Rde P, Silva ME, Pedrosa ML. (2012). Iron overload potentiates diet-induced hypercholesterolemia and reduces liver PPAR-α expression in hamsters. J Biochem Mol Toxicol. 26: 224-229.
- Hamada YZ, Carlson B, Dangberg J. (2005). Interaction of Malate and Lactate with Chromium(III) and Iron(III) in aqueous solutions. Syn Reac Inorg Met-Org Nano-Met Chem. 35: 515-522.
- Hamada YZ, Holyfield H, Rosli K, et al. (2009). Equilibrium models of Cr3+ and Cu2+ with glutamate. J Coord Chem. 62: 721-733.
- Hamada YZ, Carlaon BL, Shank JT. (2003). Potentiometric and UV–Vis spectroscopy studies of citrate with the Hexaquo Fe3+ and Cr3+ metal ions. Syn Reac Inorg Metal-Org Chem. 8: 1425-1440.
- Hamada YZ, Bayakly N, Peipho A, et al. (2006). Accurate potentiometric studies of chromium-citrate and ferric-citrate complexes in aqueous solutions at physiological and alkaline pH values. Syn Reac Inorg Met-Org Nano-Met Chem. 36: 469-476.
- Moncol J, Kalinakova B, Svorec J, et al. (2004). Spectral properties and bio-activity of copper(II) clofibriates, part III Crystal structure of Cu(clofibriate)2(2-pyridylmethanol)2, Cu(clofibriate)2 (4-pyridylmethanol)2(H2O) dihydrate, and Cu2(clofibriate)4(N,N diethylnicotinamide)2. Inorg Chim Acta. 357: 3211-3222.
- Huang HL, Shaw NS (2002). Role of hypolipidemic drug clofibrate in altering iron regulatory proteins IRP1 and IRP2 activities and hepatic iron metabolism in rats fed a low-iron diet. Toxicol Appl Pharmacol. 180:118-28.
- Ghauch A, Abou Assi H, Tuqan A. (2010). Investigating the mechanism of clofibric acid removal in FeO/H2O systems. J Hazar Mater. 176: 48-55.
- Alderighi L, Gans P, Ienco A, et al. (1999) Hyperquad simulation and speciation (Hyss): A utility program for the investigation of equilibria involving soluble and partially soluble species Coord. Chem Rev. 184: 311-318.
- Sweeton FH, Mesmer RE, Baes CF. (1974). Acidity measurements at elevated temperature. VII. Dissociation of water. J Sol Chem. 3: 191-214.
- Martell AE, Smith RM, Motekaitis RJ. (2001). Critical Stability Constants Database, Version 6.0, (2001) NIST, Texas A&M University, College Station, TX, USA.
- Kettle SFA. (1996). Physical Inorganic Chemistry, A Coordination Chemistry Approach, Spektrum. University Science Book, Sausalito, CA.
- Baes CF, Mesmer RE. (1967). The hydrolysis of cations. New York: Wiley and Sons.
- Hamada YZ, Harris WR, Rath N. (2013). Crystal structure of pyridoxal amino methyl phosphonic acid (PYRAMPA) and its stability constants with Al3+. International J Green and Nano Tech. 1: 1-8.
- Canbay HS, Demiralay EC, Alsancak G, et al. (2011). Chromatographic determination of pKa values of some water-insoluble arylpropionic acids and arylacetic acids in acetonitrile+water media. J Chem Eng Data. 56: 2071–2076.


Open Access Journals
- Aquaculture & Veterinary Science
- Chemistry & Chemical Sciences
- Clinical Sciences
- Engineering
- General Science
- Genetics & Molecular Biology
- Health Care & Nursing
- Immunology & Microbiology
- Materials Science
- Mathematics & Physics
- Medical Sciences
- Neurology & Psychiatry
- Oncology & Cancer Science
- Pharmaceutical Sciences