Assessment of Cytotoxicity of Imatinib for Oral Squamous Cell Carcinoma by a Real-Time Cell Analysis System.
Mai Hazekawa, Masahiko Morioka, Takuya Nishinakagawa, Tomoyo Kawakubo-Yasukochi, Seiji Nakamura, Manabu Nakashima
1Department of Immunological and Molecular Pharmacology, Faculty of Pharmaceutical Science, Fukuoka University, Japan;
2Section of Oral and Maxillofacial Oncology, Division of Maxillofacial Diagnostic and Surgical Sciences, Faculty of Dental Science, Kyushu University, Japan.
- Corresponding Author:
- Mai Hazekawa
Department of Immunological and Molecular Pharmacology
Faculty of Pharmaceutical Science
Fukuoka University, Japan
Tel: 81-92-871-6631
Fax: 81-92-863-0389
E-mail: mhaze@fukuoka-u.ac.jp
Received date: November 30, 2016; Accepted date: January 06, 2017; Published date: January 13, 2017
Citation: Hazekawa M, Morioka M, Nishinakagawa T, et al. Assessment of cytotoxicity of imatinib for oral squamous cell carcinoma by a real-time cell analysis system. Electronic J Biol, 13:1
Abstract
Background: A Real-Time Cell Analysis (RTCA) system has been developed as a cell monitoring device which detects changes in impedance as cells attach and spread in a sensor well. Assessment of cell adhesion and spread is important to characterize the biological status of adherent cells, and to evaluate mitochondrial activity during cytotoxicity assays. However, practical applications of the RTCA system have not been fully explored. The purpose of this study is to find the availability of evaluation used by RTCA system (characterized by real-time measurement and cell impedance monitoring) compared with WST-8 assay as one of the useful new methods in the cytotoxicity assay. Methods and findings: The iCELLigence system was used as an RTCA device in conjunction with SQUU-A, SQUU-B, SAS, and NA human oral squamous cell carcinoma cell lines. Cells were incubated on culture plates for 24 h and then treated with the cytotoxic agent imatinib. Cells were incubated for an additional 72 h with sensor devices placed in the incubator to measure real-time cell index (CI) data by the RTCA system over the experimental period. The calculated IC50 values of imatinib exhibited high correlation with those of real-time CI measures using the RTCA system. Furthermore, the real-time IC50 changed with culture time. Additionally, the IC50 values calculated by the RTCA system were lower than those calculated by the WST-8 assay at end-point measurements as a conventional method. Conclusions: The RTCA system can evaluate the change of cytotoxicity with culture time using realtime IC50 compared with end-point assay. The RTCA system can sensitively evaluate the influence of cytotoxic reagents on cell adhesion. Furthermore, this system could be used to evaluate combined therapy or drug interactions with real-time monitoring in the future.
Keywords
RTCA system; IC50 value; cytotoxicity; Oral squamous cell carcinoma; Imatinib
Introduction
The Real-Time Cell Analysis (RTCA) system has been introduced for continuous monitoring of adherent cell cultures [1]. This label-free and non-invasive method is based on the measurement of electrical impedance between interdigitated regions on the base of tissue culture plates. The impedance measurement provides quantitative information about the biological status of adherent cells, including cell number, viability, and morphology, as a real-time profile [2-4]. Imatinib cytotoxicity in oral squamous cell carcinoma has been assessed using the WST-8 assay as an end-point measurement in our previous study [5].
MTT and WST-8 assays are commonly used to evaluate cytotoxicity at end-point measurement. The WST-8 assay measures the level of formazan pigment reduced by a mitochondrial dehydrogenase. The amount of formazan dye generated by active mitochondria is proportional to the number of living cells.
We focused on a new devise at real-time measurement, and determined the differences between end-point measurement and real-time measurement in cytotoxicity assay because there were passible that reaction time is differences in cell lines or reagents.
Imatinib, as the model reagent in this study, was originally designed as a therapeutic for chronic myeloid leukemia. Imatinib acts by inhibiting cell proliferation through targeting of Bcr-Abl tyrosine kinase (TK) [6-8].
Oral squamous cell carcinoma (OSCC), as the model cell line in this study, is currently treated largely by surgery and/or irradiation, although several unequivocal controlled trials of different treatment modalities have been conducted. Photodynamic and chemotherapy have occasional applications, with an increased use of chemotherapy, including targeted therapy, in recent years [9,10]. Molecular target drugs are developed following the identification of gene products that are expressed at high levels, and are therefore expected to possess fewer side effects than conventional chemotherapeutic agents [11].
Generally, the effects of cytotoxic reagents vary with time for individual cell lines. Therefore, the realtime measurement is important to know the detail reaction of cells for cytotoxic reagents with time when evaluating cytotoxic reagents.
The purpose of this study is to find the availability of real-time measurement compared with endpoint assay and the usefulness of cell impedance monitoring using RTCA system as one of the cytotoxicity assay.
Materials and Methods
Regent and materials
Imatinib (Focus Biomolecules, Plymouth Meeting, PA, USA) was diluted in 50 mM dimethylsulfoxide (DMSO; Sigma–Aldrich Inc., St. Louis, MO, USA) and stored at −20°C. DMSO. Type I bovine collagen (Collagen type I) was purchased from Thermo Fisher Scientific Inc. (Waltham, MA, USA). Human Fibronectin (HFN) was purchased from Corning Inc. (New York, NY, USA).
Cell culture
The human oral cell carcinoma (OSCC) cell lines, SQUU-A, SQUU-B, SAS, and NA were derived from human tongue samples. SQUU-A and SQUU-B were established from local recurrent tongue cancer tumors [12]. SAS purchased from RIKEN BRC CELL BANK (Tsukuba, Japan) [13-15]. NA was kindly provided by Dr. Jun-ichi Iwata (Kyushu University; Fukuoka, Japan) [16]. All cell lines were maintained in Dulbecco’s Modified Eagle Medium (DMEM) (Nacalai Tesque Inc., Kyoto, Japan) containing 10% fetal calf serum (Biowest, France) at 37°C on cell culture plates in a humidified atmosphere with 95% air and 5% CO2.
Plate coating with collagen type I and HFN
Coated plates were prepared by adding 100 μL (including 2 μg of collagen type I or HFN) of collagen type I or HFN solutions (20 μg/mL in distilled water) to each well of an 8-well E-Plate (E-Plate L8) for RTCA and the plates were incubated for 2 h at room temperature. After incubation, plates were washed twice with phosphate-buffered saline and DMEM was then added [17]. E-palates were coated with 5 μg/ cm2 collagen type I diluted in 20 mM CH3COOH.
Measurement of OSCC cell proliferation by in vitro RTCA cytotoxicity assay
The real-time cell index (CI) data acquisition was initiated using iCELLigence (ACEA Bioscience. Inc. San Diego, CA, USA) as an RTCA system under 37°C with regulated CO2 content (5%) condition.
Collagen type I-coated E-plates containing 200 μL DMEM culture medium per well were equilibrated at 37°C and the electrical microimpedance signal (CI) was set to zero in these conditions. Cells (2 × 10⁴ cells/well if not specified otherwise) were added in 560 μL of suspension in DMEM. After cell attachment, the cells were incubated for 96 h. Cells under each culture condition were observed under bright-field using a phase contrast microscope (EVOS, Thermo Fisher Scientific Inc.). The IC50 value was calculated by RTCA DATA Analysis Software1.0 (ACEA Bioscience. Inc.).
Curve Fit Formula: There is the formula available for calculating IC50 values as follows,
Sigmoidal dose-response

Bottom: minimum cell index values
Top: maximum cell index values
Statistical analysis
All data were expressed as mean ± SD (standard deviation) from three independent experiments. Multivariate analysis of variance (MANOVA) was used for IC50 curve fitting. A P-value of less than 0.05 was considered statistically significant.
Results
Effect of the number of OSCC cells seeded on E-plates coated with collagen type I on cell proliferation
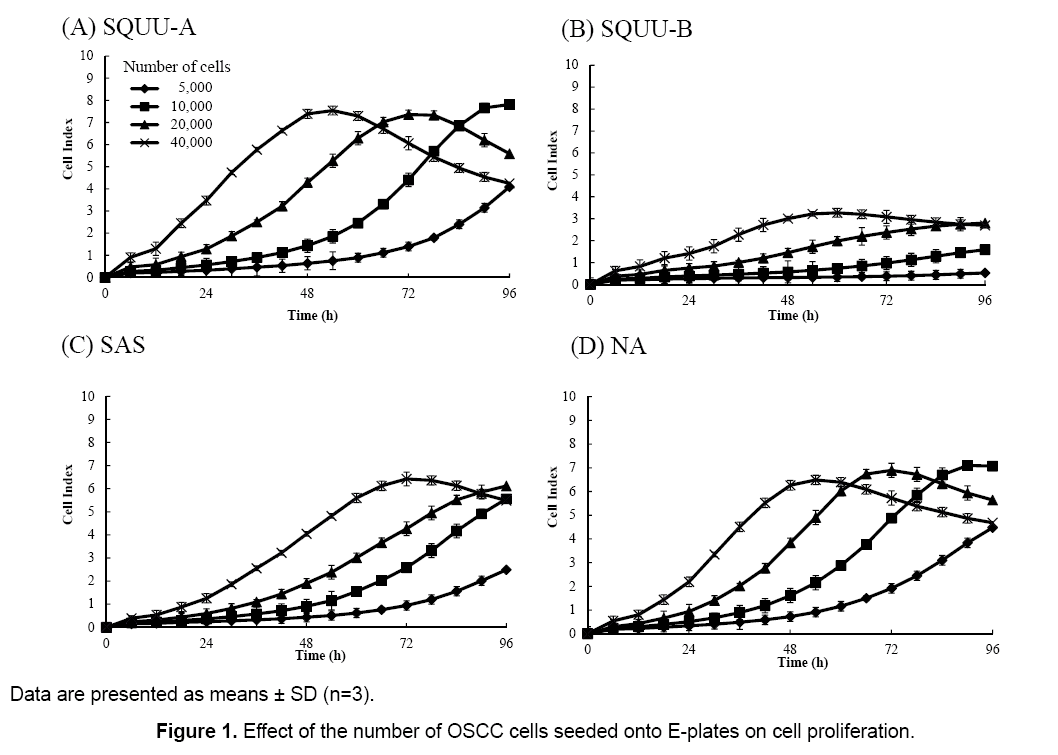
The influence of the number of cells seeded on cell proliferation was evaluated by measuring CI values 72 h after seeding cells onto E-plates at 0.5 × 10⁴, 1 × 10⁴, 2 × 10⁴, and 4 × 10⁴ cells/well (Figure 1). CI values increased with increased numbers of cells seeded in all cell lines. Furthermore, CI values were decreased when cells were grown to confluency. We desired CI values to achieve maximal values between 72 and 96 h after cell seeding, so a seeding concentration of 2 × 10⁴ cells/well was chosen.
Effect of coating condition on OSCC cell proliferation
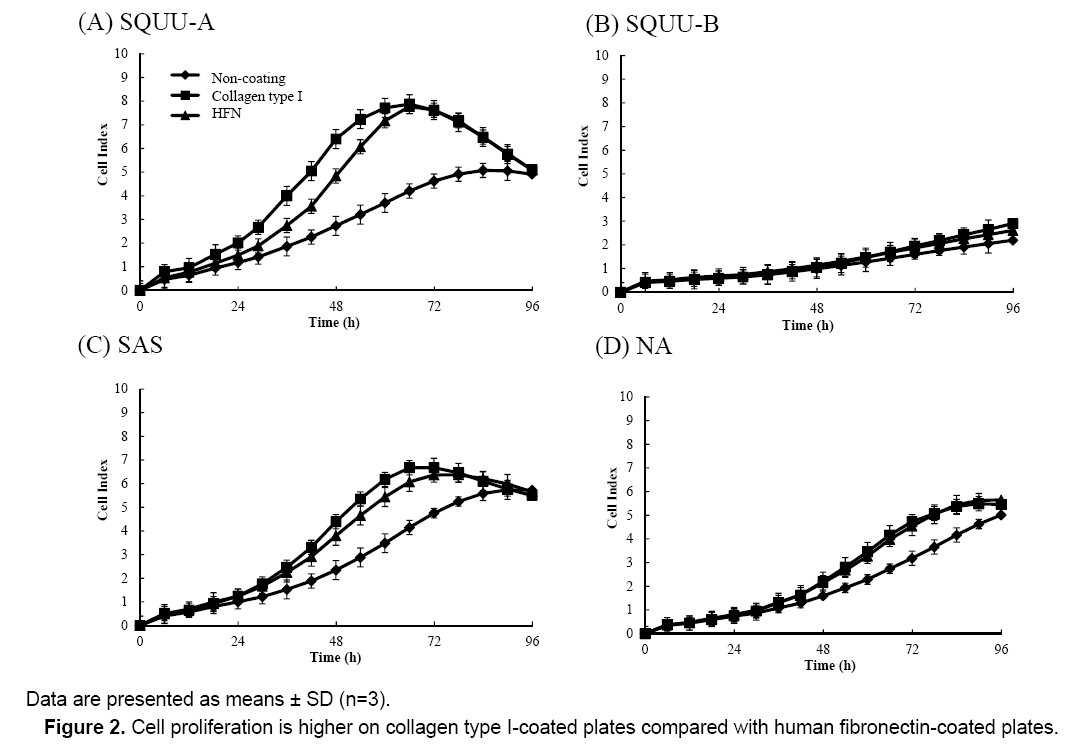
We next determined the influence of culture surface coating conditions on cell proliferation by measuring CI values of OSCC cells seeded at 2 × 10⁴ cells/well on plates coated with collagen type I or HFN after 72 h incubation (Figure 2). CI values were higher for cells seeded on E-plates coated with HFN or collagen type I compared with uncoated plates. Additionally, the CI values of cells on E-plates coated with collagen type I were higher than those of cells on E-plates coated with HFN. Therefore, all further experiments in this study were conducted using E-plates coated with collagen type I.
Effect of concentration of imatinib on OSCC cell proliferation
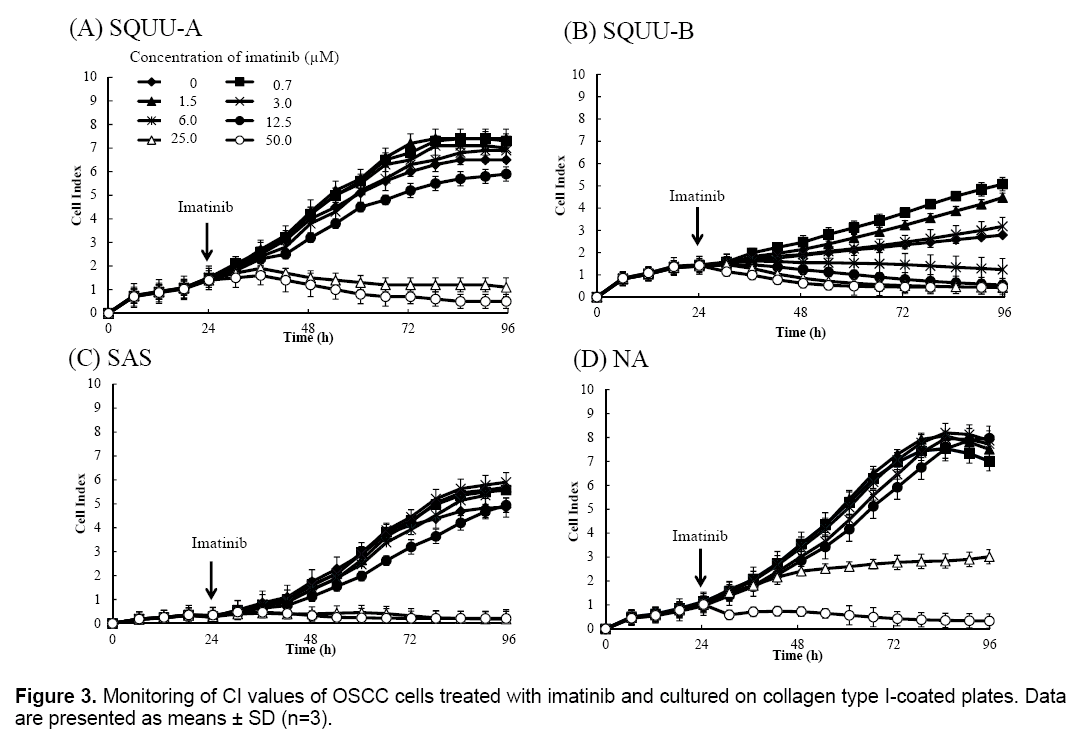
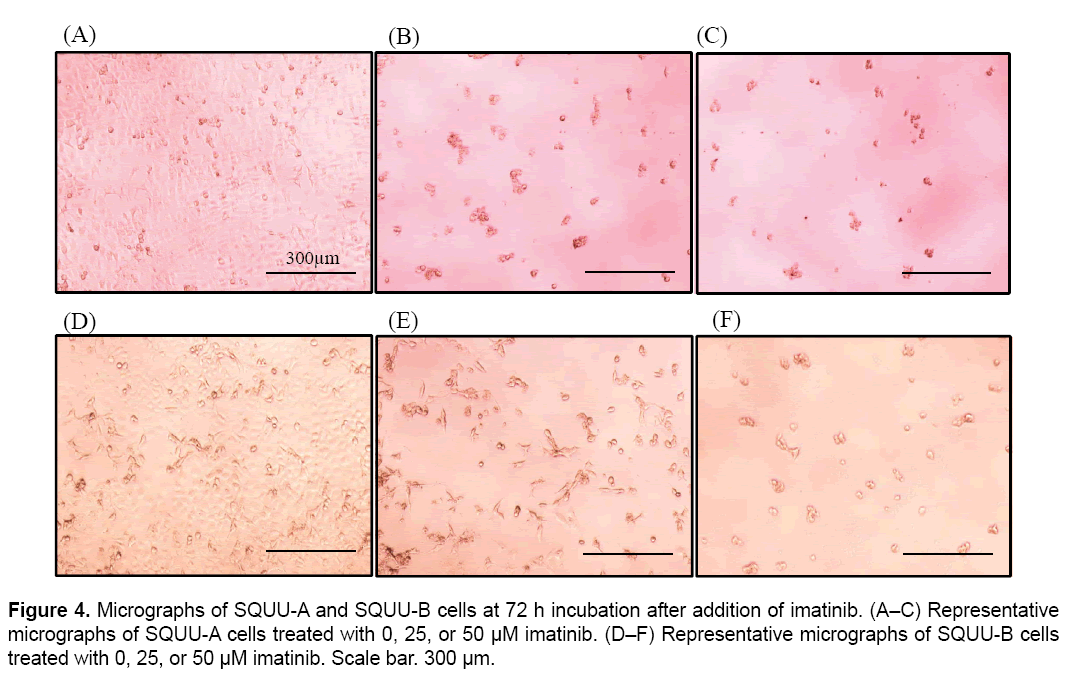
We then evaluated the cytotoxicity of imatinib for OSCC cells by monitoring CI values for 96 h after seeding cells at 2 × 10⁴ cells/well on E-plates coated with collagen type I (Figure 3). CI values were suppressed in a dose-dependent manner in all OSCC cells over 3.0 μM of imatinib. Microphotographs of bright-field phase contrast microscopy depicting the suppression of SQUU-A and SQUU-B cell proliferation over 96 h of monitoring are also shown in Figure 4. These results demonstrate that the reduction of CI values correlated with a decreased of number of cells.
Calculation of the IC50 value of imatinib for OSCC cells using the RTCA system
Finally, we evaluated the cytotoxicity of imatinib for OSCC cells by determining the IC50 values by RTCA using DATA Analysis Software 1.0 and CI values obtained from 96 h of monitoring (Figure 3) as shown in Table 1. IC50 values of imatinib were calculated with high correlation between all OSCC cell lines. IC50 values of imatinib for OSCC cells were changed with increased incubation time.
| Cell Type | 48 h | 72 h | 96 h | |
|---|---|---|---|---|
| SQUU-A | IC50 (μM) | 22.02 ± 4.12 | 6.23 ± 2.21 | 4.09 ± 2.12 |
| R2 | 0.99** | 0.97** | 0.97** | |
| SQUU-B | IC50 (μM) | 7.01 ± 4.22 | 3.12 ± 2.56 | 2.08 ± 1.11 |
| R2 | 0.99** | 0.99** | 0.97** | |
| SAS | IC50 (μM) | 32.68 ± 7.34 | 37.02 ± 6.87 | 52.43 ± 7.12 |
| R2 | 0.93** | 0.91** | 0.86** | |
| NA | IC50 (μM) | 42.23 ± 5.23 | 16.88 ± 3.32 | 21.22 ± 6.61 |
| R2 | 0.97** | 0.94** | 0.88** | |
Table 1: IC50 values of imatinib determined using the RTCA system at 48, 72 and 96 h incubation
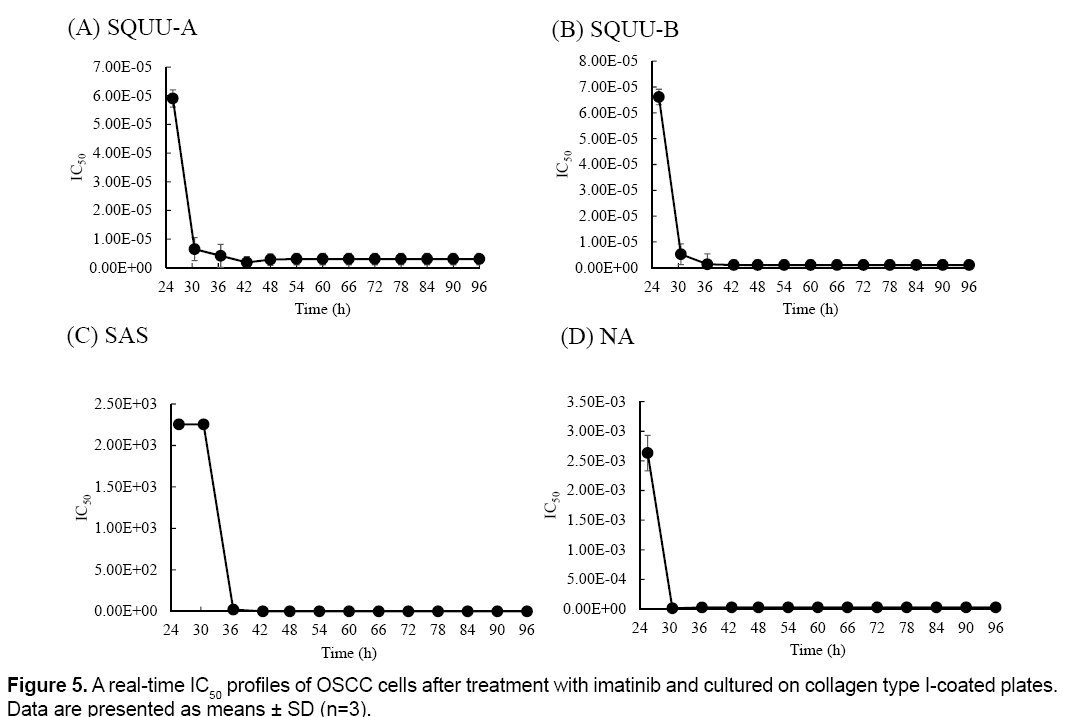
Real-time IC50 profiles were shown in Figure 5. Realtime IC50 was changed with culture time in all OSCC cell lines. SQUU-A needed over 18 h-incubation time after addition of imatinib to obtain the stable IC50 values. SQUU-B, SAS, NA also needed over 12, 12, 6 h-incubation time after addition of imatinib, respectively.
Discussion
The RTCA system is unlike traditional end-point assays in that the readout of impedance is non-invasive and can provide high-quality continuous and quantitative information regarding cytotoxicity levels at exact times. CI values are used to represent cell status based on the measured electrical impedance [3]. The calculation of frequency-dependent electrode impedance with or without cells present in the wells and the corresponding CI values has been described previously [3].
Figure 1 demonstrates that the CI value depends on the number of cells attached to the electrode. If no cells are present on the electrodes, the CI value is 0. The more cells that attach to the electrodes (i.e. an increase in cell adhesion or cell spread), the higher the CI value obtained. Therefore, any factor that affects the number of cells will cause a change in the CI value.
SQUU-A and SQUU-B cell lines were established from an OSCC lesion from a single patient. The CI values for SQUU-B cells were lower than those of other OSCC cells. Furthermore, cervical lymph node metastasis was detected in mice orthotopically implanted with SQUU-B cells, but not with SQUU-A cells [12]. The adhesion protein E-cadherin plays an essential role in metastasis, with reduced levels of E-cadherin promoting cell migration and cell invasion [18]. These previous findings suggest that the reason for the low CI values obtained for SQUU-B cells may be because these cells have a lower capacity for adhesion because of reduced levels of E-cadherin.
In general, intensity of adhesion in adherent cell is differed by the kind of cell line. In particular, intensity of squamous cell carcinoma such as four cell lines used in this study is higher than stromal carcinoma or adenocarcinoma in our study (data not shown). Furthermore, NA has known to produce the fibronectin [16]. These finding suggested that the high intensity of adhesion cell line such as OSCC cells is useful to evaluate cytotoxicity using RTCA system because it is easy to find the differences of CI values.
Figure 2 also shows that cell proliferation was higher on plates coated with collagen type I. This is consistent with our previous findings [5]. To increase experimental efficiency, E-plates coated with collagen type I as high cell proliferation condition were used in our experiments.
The CI values obtained for SQUU-A and SQUU-B cells in the absence of imatinib were lower than those obtained using increasing concentrations of imatinib (Figure 3A and B). However, micrographs of SQUU-A and SQUU-B cells in the absence of imatinib taken after 96 h incubation demonstrated cell confluency while low-concentration imatinib groups had higher CI values compared with the absence of imatinib (data not shown). These results suggest that the higher CI values obtained under low-dose imatinib conditions are attributable to the stimulation of cell adhesion, with cell death not occurring at these low concentrations of imatinib.
CI values were suppressed in a dose-dependent manner in all OSCC cells over 3.0 μM of imatinib though CI values were not suppressed in low concentration of imatinib. These results showed that there was range of effective concentration of reagent in CI profile representing dose-dependent manner in the results using RTCA system.
Table 1 demonstrates a high correlation in the calculated IC50 values for imatinib. Furthermore, real-time monitoring of IC50 values revealed that they changed with increased culture time.
The cytotoxicity assay with end-point assay were operated at 12, 24, 48, 72 h after addition of reagent. However, IC50 of imitinib in SQUU-A at 12 h is not stable as shown in Figure 5. These results suggested that it is possibility to evaluate IC50 at not enough incubate time to effect cytotoxicity in case of end-point measurement. Therefore, real-time measurement using RTCA system has the advantage because this device can monitor of cell adhesion reaction during experimental periods. These information are beneficial for clinical applications of anti-cancer drugs, as IC50 values calculated by conventional methods that employ end-point measurements may result in higher doses being administered. Such overdoses may cause side effects.
In our previous study, IC50 values of SQUU-A, SQUU-B, SAS and NA at 24 h incubation after addition of imatinib used by WST-8, were 60.01 ± 6.79, 57.06 ± 4.89, 48.35 ± 3.28 and 56.34 ± 6.67, respectively [5]. While, IC50 values of SQUU-A, SQUU-B, SAS and NA at 24 h incubation after addition of imatinib used by RTCA system in this study, were 22.02 ± 4.12, 7.01 ± 4.22, 32.68 ± 7.34 and 42.23 ± 5.23, respectively. As shown in Table 1, the lowest IC50 value of SQUU-A, SQUU-B, SAS and NA during experiment period, were 4.09 ± 2.12, 2.08 ± 1.11, 32.68 ± 7.34 and 16.88 ± 3.32, respectively. The IC50 values calculated using the RTCA system in our current study are lower than obtained using a WST-8 assay in our previous study. In general, the IC50 values calculated using in vitro end-point assays tend to be higher than the effective concentration in vivo [19,20]. These our results were correlated with previous data.
The reason of these results, which is that IC50 value of RTCA system is lower than one of WST-8 assay, also suggested that the RTCA system can sensitively evaluate the cytotoxicity and influence on cell adhesion of anticancer agents. Therefore, assessment using the RTCA system might mimic the cytotoxic reaction in vivo for anti-cancer agents. RTCA system is the one of useful method to evaluate cytotoxicity in real-time. Therefore, another assay about cytotoxicity such as MTT assay, TUNEL, AnnexinV stainig should be performed, when the detail mechanism of reagent was determined.
Unlike traditional end-point assays, the RTCA system can evaluate anti-cancer agent cytotoxicity using real-time IC50 values. Furthermore, RTCA system is the new principal device using intensity of impedance as cell adhesion. Our results demonstrate that the RTCA system is a useful cytotoxicity assay that could be used in the development of chemotherapeutic agents in the future. Additionally, the RTCA system could be used to evaluate combined therapy or drug interactions.
References
- Xing JZ, Zhu L, Jackson JA, et al. (2005). Dynamic monitoring of cytotoxicity on microelectronic sensors. Chem Res Toxicol. 18: 154-161.
- Xing JZ, Zhu LJ, Gabos S, Xie L. (2006). Microelectronic cell sensor assay for detection of cytotoxicity and prediction of acute toxicity. Toxicol In Vitro. 20: 995-1004.
- Zhu J, Wang X, Xu X, Abassi YA. (2006). Dynamic and label-free monitoring of natural killer cell cytotoxic activity using electronic cell sensor arrays. J Immunol Methods. 309: 25-33.
- Xi B, Yu N, Wang X, Xu X, Abassi YA. (2008). The application of cell-based label-free technology in drug discovery. Biotechnol J. 3: 484-495.
- Toga W, Kondo M, Tokoro A. (2003). Preclinical and clinical profile of imatinib mesylate, a potent protein-tyrosine kinase inhibitor for CML therapy. Nihon Yakurigaku Zasshi. 121: 119-128.
- Grebien F, Hantschel O, Wojcik J, et al. (2011). Targeting the SH2-Kinase Interface in Bcr-Abl Inhibits Leukemogenesis. Cell. 147: 306–319.
- Buchdunger E, Zimmermann J, Mett H, et al. (1996). Inhibition of the Abi Protein-Tyrosine Kinase in Vitro and in Vivo by a 2-Phenylaminopyrimidine Derivative. Cancer Res. 56: 100-104.
- Morioka M, Hazekawa M, Kawakubo-Yasukochi T, et al. (2016). Effect of collagen type I or human fibronectin on imatinib cytotoxicity in oral squamous cell carcinoma. Pharmacol & Pharm. 7: 255-263.
- Nwizu T, Adelstein D. (2015). Pharmacotherapy of head and neck cancer. Expert Opin Pharmacother. 16: 2409-2422.
- Vanderveken OM, Szturz P, Specenier P, et al. (2016). Gemcitabine-Based Chemoradiation in the Treatment of Locally Advanced Head and Neck Cancer: Systematic Review of Literature and Meta-Analysis. Oncologist. 21: 59-71.
- Yamori T. (2006). Overview of molecular target-based drugs. Drug Delivery System. 21: 18-23.
- Morifuji M, Taniguchi S, Sakai H, et al. (2000). Differential Expression of Cytokeratin after Orthotopic Implantation of Newly Established Human Tongue Cancer Cell Lines of Defined Metastatic Ability. Am J Pathol. 156: 1317-1326.
- Takahashi K, Kanazawa H, Akiyama Y, et al. (1989). Establishment and characterization of a cell line (SAS) from poorly differentiated human squamous cell carcinoma of the tongue. J Jpn Stomatol Soc. 38: 20-28.
- Hung CM, Chang CC, Lin CW, Ko SY, Hsu YC. (2013). Cucurbitacin E as Inducer of Cell Death and Apoptosis in Human Oral Squamous Cell Carcinoma Cell Line SAS. Int J Mol Sci. 14: 17147-17156.
- Chen YW, Huang HS, Shieh YS, et al. (2014). A novel compound NSC745885 exerts anti-tumor effect on tongue cancer SAS cells in vitro and in vivo. PLOS ONE. 9: e113703.
- Yoshiya M. (1990). A fibronectin-producing cell line established from a human squamous cell carcinoma of the tongue and its characterization. Jpn J Oral Maxillofac Surg. 36: 868-880.
- Kleinman HK, Klebe RJ, Martin GR. (1981). Role of Collagenous matrices in the adhesion and growth of cells. J Cell Biol. 88: 473-485.
- Zhao P, Guo S, Tu Z, et al. (2016). Gihl3 induces human epithelial tumor cell migration and invasion via downregulation of E-cadherin. Acta Biochim Biophys Sin (Shanhai). 48: 266-274.
- McEneny-King A, Edginton AN, Rao PP, (2015). Investigating the binding interactions of the anti-Alzheimer’s drug donepezil with CYP3A4 and P-glycoprotein. Bioorg Med Chem Lett. 25: 297-301.
- Ota T, Shinotoh H, Fukushi K, et al. (2010). Esyimation of plasma IC50 of donepezil for cerebral acetylcholinesterase inhibition in patients with Alzheimer disease using positron emission tomography. Clin Neurophaemacol. 33: 74-78.

Open Access Journals
- Aquaculture & Veterinary Science
- Chemistry & Chemical Sciences
- Clinical Sciences
- Engineering
- General Science
- Genetics & Molecular Biology
- Health Care & Nursing
- Immunology & Microbiology
- Materials Science
- Mathematics & Physics
- Medical Sciences
- Neurology & Psychiatry
- Oncology & Cancer Science
- Pharmaceutical Sciences
