A Retrospective Research of Osteoporosis Diagnostic Criteria in China with Evidence Based Medicine
Zhihai Zhang, Jianxiong Shen, Zhonghou Liu
Department of Orthopaedic Surgery,Peking Union Medical College Hospital,Beijing 100730,China
Abstract
According to evidence based medicine, about 10 years bone mineral density (BMD) results were analyzed retrospectively which came from DEXA, pDEXA, RA, and SPA methods in China mainland. This paper tries to get out Chinese osteoporosis diagnostic criteria more objectively and more exactly. Searching Chinese magazine and paper databases, 52,166 male case-times and 107,929 female case-times BMD lose rate data were quoted and calculated from 49 papers. The average values and standard deviations also were calculated by SPSS 11.0 (SPSS Inc., Chicago, IL) and the BMD lose rate curves were drawn according to 10 to 90 years old phases. It is suggested that the Chinese criteria of osteoporosis diagnosis should use 25% in BMD lost rate or 2 SD. The measure position is suggested in some sequences that femoral neck is better than forearms, lumbar P-A position, phalanges (2nd, 3rd, and 4th) detected by RA and femoral Troch’s region. The femoral WARD’s region and lumbar lateral measurements are not supported. To use evidence based medicine can get more accuracy and more reliable results. It is worthy of developed, deeper research.
Key words
Evidence based medicine; Osteoporosis; Diagnostic criteria; BMD lost rate; DEXA; pDEXA; SPA; RA.
1. Introduction
In this century,China’s population has risen to 1.3 billion. There are about 10% people older than 60 years old. That means there are a huge amount of osteoporosis patients in China mainland. So it is very important to confirm an easy remember and scientific China osteoporosis diagnostic criteria.
In many researches,reporters analyzed the incidences of osteoporosis in the different areas according to peak value of bone mineral density (BMD) lost 2.5 SD. However,there remains a question that couldn't be ignored. This question is the diagnostic criteria used by many researches were American Criteria and China Criteria that are commended by Osteoporosis Committee of China Gerontological Society (OCCGS) in 1999,though these criteria still remain many disputes themselves.
In order to establish an actual popular criterion of Chinese osteoporosis,we try to collect and analyze the data of DEXA,pDEXA,RA,SPA from relative China cultures since 1994. So we may get some more scientific,actual and effective results.
2. Materials and Methods
2.1 Data Resources
Data were cited from officially published Chinese medical journals since 1994 in the Chinese Medical Database from China Union Medical University Library (1-45). Bone mineral density (BMD) data (from published tables of the literature) measured by DEXA,pDEXA,SPA,RA (Middle segment of phalanges 2nd,3rd,4th) was included for analysis. Data of QCT,PQCT,and ultrasound was excluded from the analysis of the paper. In total,there were 107,929 case-times female data,and 52,166 casetimes male data. The results of SPA data measured prior to 1997 were as result cells here,but its 40,000 patients cases were excluded from statistics.
2.2 Calculation Method and Statistics
There are currently several different DEXA machines from different manufacturers in China. It is obviously that the peak bone mass value,BMD and standard deviations vary from one brand of DEXA machine to another. It is inappropriate to compare the data directly collected from different brands of DEXA machines. To avoid the confusion of diagnosis and data analysis,we suggest implementing the percentage change of the BMD loss as a calculation tool and diagnostic criteria.
BMD lose rate of different age groups was used directly for data analysis. BMD data presented with average values and standard deviations (Mean ± SD) was calculated,and then converted into BMD lose rate before the statistical analysis. SPSS11.0 (SPSS Inc.,Chicago,IL) and Excel 2000 (Microsoft inc.) were used for data analysis. The BMD lose rate curves were drawn from 20 to 90 years old phases.
3. Results
52,166 case-times male BMD lose rate showed in Table 1~7 according to measuring sites,ages and methods. Also,some age-BMD lose rate curves were drawn in Figure 1~7. Different measuring sites’BMD lose rate values and curves were different (Table 8 and Figure 8 ),especially at average values and standard deviations. From upper data and curves,most curves coincide and are close to each other. All these curves could reflect the real trend of old Chinese people. The results and curves of men femoral neck are located in the middle of these curves that could show the actual osteoporotic state. There are 18 percent BMD lose rate when men are 60-70 years old and 22 percent at 70-80 years old. This rate is up to the actual osteoporotic state. Forearm,lumbar vertebra P-A position and femoral Troch region also fit to the state. Though RA (Middle segment of phalanges 2nd,3rd,4th) results zigzagged a lower curve,it is a very simple and relative stabilization measuring method which made it a relative objective values. So,the China male osteoporosis diagnostic criteria should be 25% BMD lose rate or 2SD and the real diagnosis age is about 70 years old. Because there are obvious differences from the values of femoral neck (p<0.05),the femoral WARD’s region measurements are not supported. That means it will be 28% BMD lose rate at 60 years old. It is not clinical reality. The value of lateral lumbar measurement are also obvious differences from the values of femoral neck (p<0.05) at 20~40 and 70~90 years old. Lumbar hyperosteogeny will disturb the measurement results. So the femoral WARD’s region and lateral lumbar measurement should not be supported.
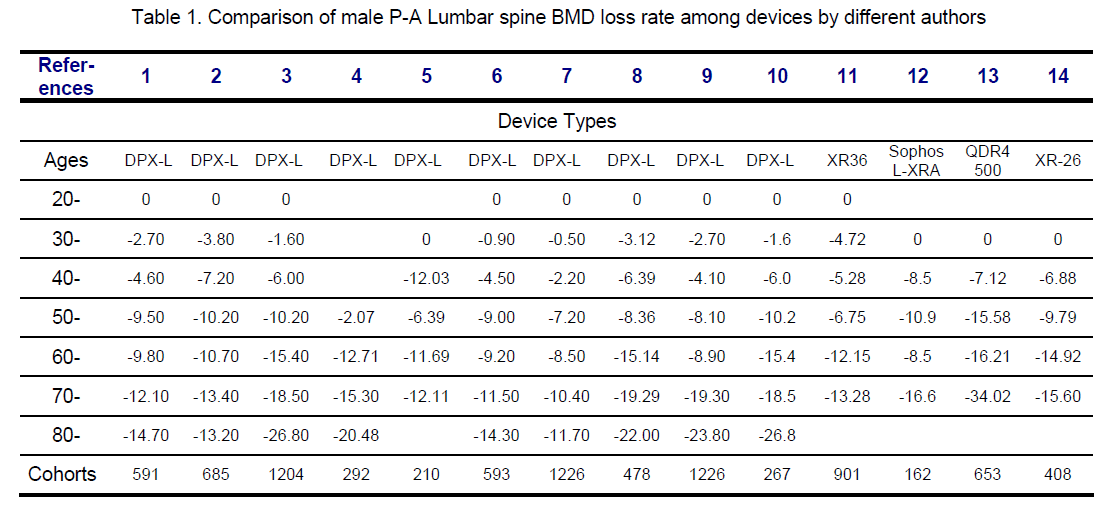
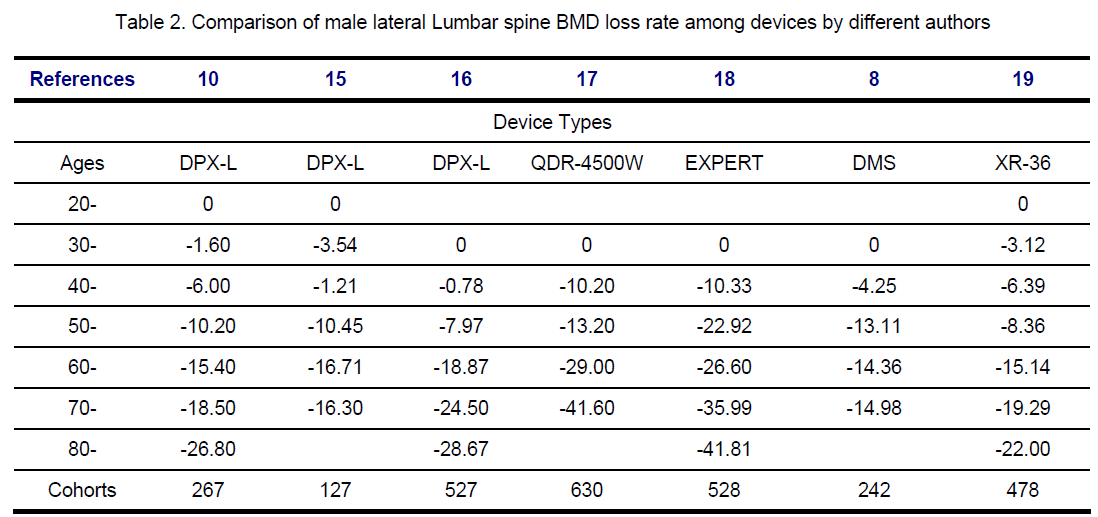
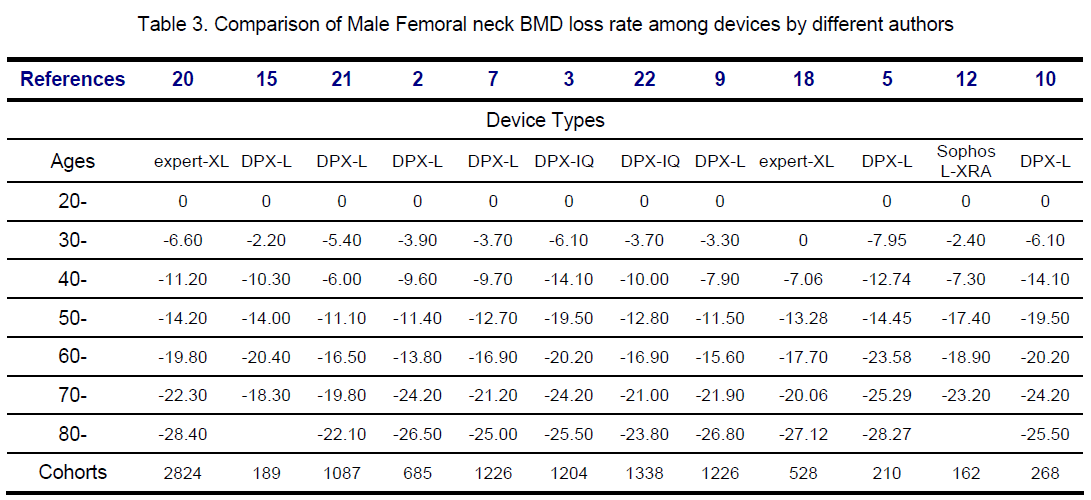
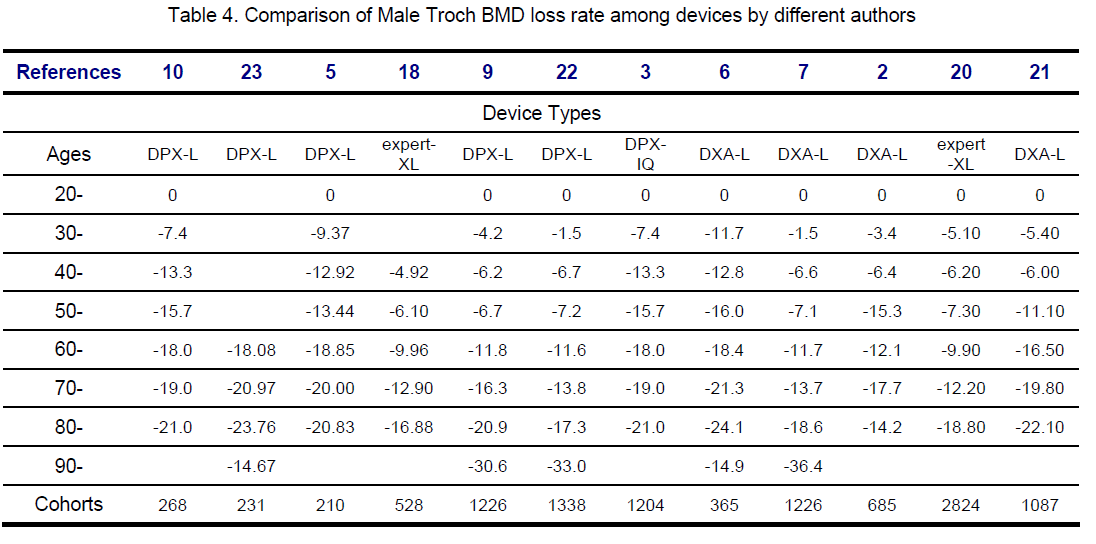
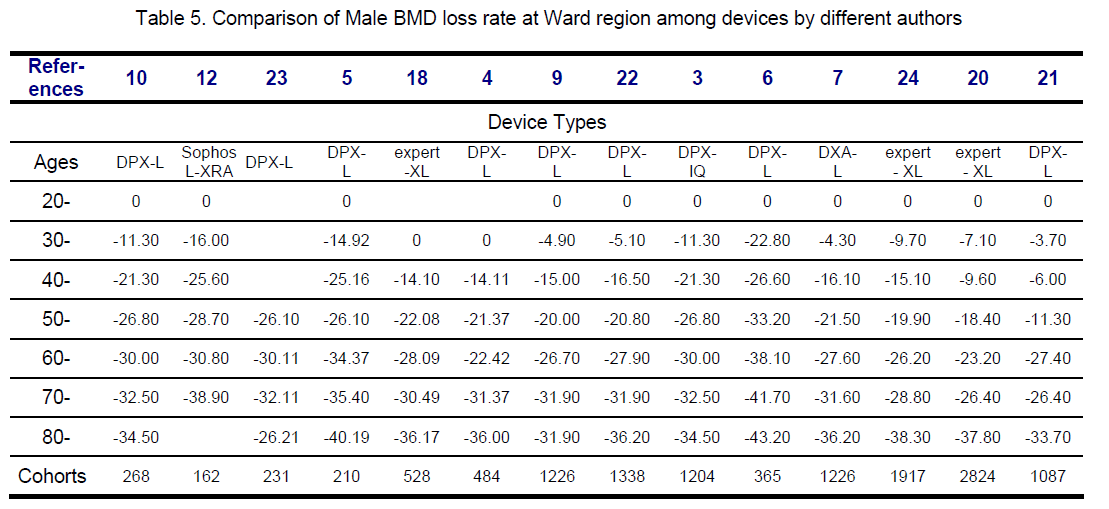
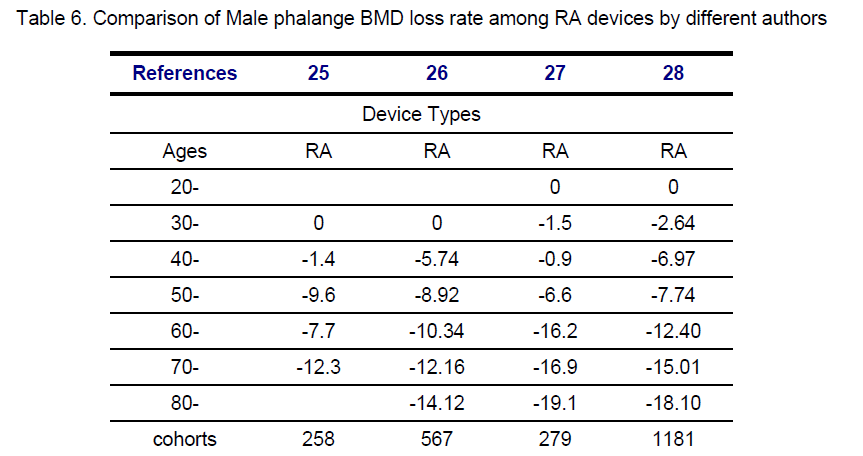
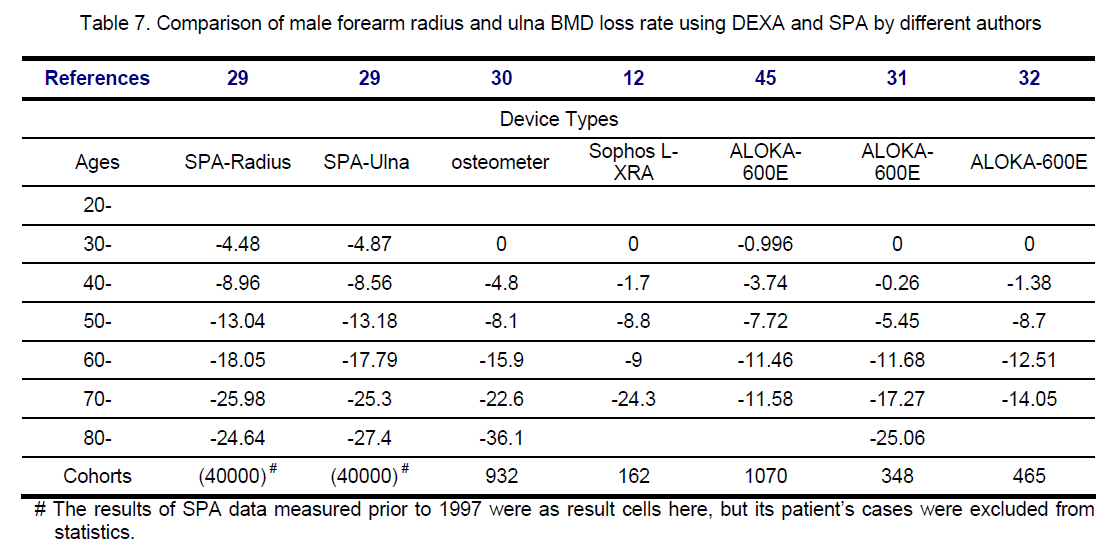
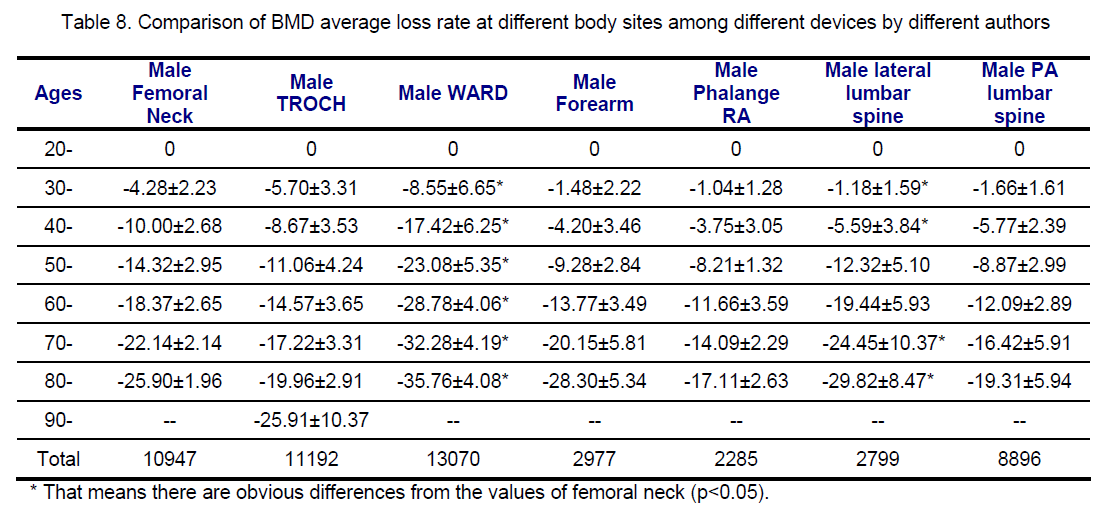

Figure 1. 8896 cases male PA Lumbar Spine BMD Loss rates.

Figure 2. 2799 cases male lateral spine BMD loss rates.

Figure 3. 10947 cases male femoral neck BMD loss rates.

Figure 4. 11192 cases male Troch BMD loss rates.

Figure 5. 13070 cases male Ward BMD loss rates

Graph. 6:、2285 cases male phalange BMD loss rates

Graph. 7:2977 cases male forearm radius and ulna BMD loss rates using DEXA and SPA.

Graph. 8:Comparison of male BMD loss rates at different body sites.
107,929 case-times female BMD lose rate showed in Table 9~15 according to measuring sites,ages and methods. Also,some age-BMD lose rate curves were drawed in graph 9~15. Different measuring sites’ BMD lose rate values and curves were different (Table 16 and graph 16),especially at average values and standard deviations. Because of about double samples,female results could show more real trend of osteoporosis than that of male. The female femoral neck values show that only 4 percent of BMD lose rate at 40 years old before emmenia over. After 50 years old,most women have no emmenia and there are more BMD lose rate. So 25 percent loss at 60 years old and 30 percent at 70 years old. Especially,curves of forearm and lumbar P-A position are coincided with femoral neck that is never reported before. Though femoral Troch region curve is lower than the former curves,it can be as measuring and diagnosis position. The femoral WARD and lateral lumbar should not be diagnosis region because there are higher curves that have significant difference from femoral neck. Not only P<0.05,but 36 percent lose rate after 60 years old. It falls short of Chinese reality. So it is counterevidence of 25 percent BMD lose rate and 2 SD as diagnostic criteria.


Figure 9. 23912 cases Female P-A lumbar spine BMD loss rates.

Figure 10.5060 cases Female lateral lumbar spine BMD loss rates.

Figure 11.24538 cases female femoral neck.

Figure 12:24538 cases female TROCH BMD loss rates.

Figure 13:24538 cases female WARD BMD loss rates.

Figure 14:2598 cases female phalange BMD loss rates by RA.

Figure 15:2745 cases Female forearm radius and ulna BMD loss rates using SPA and DEXA.

Figure 16:Female BMD loss rates at different sites.
4. Discussion
Evidence based medicine is very important to establish policies for government medical department. It is difficult to determinant a scientific and reasonable diagnosis criteria without Evidence based medicine certification. Its connotation is,according to results of multi-center research studies with some requests,to set up these disputed diagnostic criteria.
To keep agreement with the WHO criteria,we have previously used the same cut off value of –2.5 SD as the diagnostic criteria for osteoporosis in Chinese women in year 2000 (46). It also suggests this cut off value for men as well. We now recognize that,in fact,this criterion is unsuitable for the diagnosis of osteoporosis in Chinese women and men as it is too low. By using 2.5 SD cut off value,most of Chinese particularly in men would be delayed for diagnosing as osteoporosis and will be falling into the age group of 80-90 years old. Most of the previous studies in Chinese women suggest that 2SD cut off value may be the optical cut off value used for the diagnosis of osteoporosis in Chinese women,and the results in this study support this view.
Generally,1 SD ≈ 12% BMD lose rate. Thus,25% of BMD loss rate is about 2SD. Accordingly,we suggest that applying the percent rate of BMD loss rather than SD to assess osteoporosis for clinical purpose in Chinese. In men,the cut off value is set up at 25% or 2 SD,while same values in women,too. That means he or she will be diagnosed osteoporosis when BMD lose rate is 25% or BMD decreases 2 SD. So the new criteria for diagnosis of osteoporosis in Chinese men and women are as follows: Normal: rate of BMD loss no more than 1- 12% below young adult peak BMD value. Osteopenia: rate of BMD loss no more than 13-24% below young adult peak BMD value. Osteoporosis: rate of BMD loss no more than 25-36% below young adult peak BMD value. Severe Osteoporosis: rate of BMD loss greater than 37% below young adult peak BMD value. The new Chinese diagnostic criteria is different in several aspects from the previous criteria made by several investigators (47-49),particularly the previous studies lacked of male diagnostic criteria. This criteria is easy to remember and convenient to use in clinic though male is not same as female at morbidity ages.
Inconsistencies of SD score produced by different manufacture’s DEXA instruments were reported among various bone density centers across China. It is very difficult to unify and compare the results using SD score by different population in different regions. As the percentage rate of BMD loss with age within a skeletal site were similarly reported by different studies by using different DEXA devices in different population. Thus using the percentage BMD loss is more accurate than using of the SD scores.
The advantages of using percentage rate of BMD loss over T scores in the diagnosis of osteoporosis include: (1) For the purpose of clinical practice,it is easy to understand and easy to explain to the patients; (2) Avoiding using some complicated mathematic concept such as SD in the diagnosis,moreover,SD was affected by different manufacture’s bone densitometry devices; (3) Although it might be more accurate by applying “fracture risk index”,this concept is not easy to understand and involves complicated calculations; (4) To overcome the T-score limitation caused by different machine,different center,operator and technical errors. We conclude that there is significantly clinical value by establishing a standard nation-aide criteria for the diagnosis of osteoporosis by applying percentage rate of BMD loss.
5. Conclusions
A: Man osteoporosis diagnostic criteria: rate of BMD loss is more than 25% or 2SD,the disease ages are older than 70 years old.
B: Women osteoporosis diagnostic criteria: rate of BMD loss is more than 25% or 2SD,the disease ages are older than 60 years old.
C: The suggested testing parts are followed: femoral neck> forearms > AP lumbar spine (L1-4) > Phalanges 2nd、3rd、4th tested by RA> femoral Troch’s Region. It is not recommended to use lateral lumbar spine and femoral WARD’s Region for diagnosis.
Facing increasing aging population in the near future,it is urgent to establish standard,easy to use,and reliable osteoporosis diagnostic criteria in China. The best way to reach this goal is to conduct a multi-center research study using the same protocol.
We encourage discussions and suggestions from all colleagues,clinical scientists,and clinicians.
References
- Wu Q.,Tao G.S.,Mou S.C.,et al. (1998) The Results of BMD tests in lumbar,Chinese Journal of Geriatrics,17(2): 83-86.
- Wang W.Z.,Zhao L.Q.,Liao H.Y.,et al. (2003) To discuss the standard of osteoporosis by varieties of BMD in osteoporosis patients,Chinese Journal of Osteoporosis,9(4): 326-329.
- Hou S.M.,Li X.J.,Xue J.,et al. (2002) The BMD results of normal people in Shanxi area,Journal of the Fourth Military Medical University,23(12): 1115-1117.
- Tang H.,Luo X.Z.,Ren S.M.,et al. (1997) To discuss the Chinese primary osteoporosis diagnostic criteria,Chinese Journal of Osteoporosis,3(4): 1-6.
- Liu C.J.,Sun J.C.,Yang J.C.,et al. (1999) The effect of osteoporosis diagnosis in different area,Chinese Journal of Orthopedics,19(12): 723-725.
- Wu G.Q.,Tao G.S.,Liu X.L.,et al. (1995) The BMD investigate of 1333 Beijing citizen by DEXA and the rate of osteoporosis,Chinese Journal of Osteoporosis,1(1): 76-79.
- Li N.H.,Ou P.Z.,Yang D.Z.,et al. (2001) The research of BMD standard in some China area,Chinese Journal of Orthopedics,21(5): 272-275.
- Zhu J.H.,Liu Y.,Zhang W.G.,et al. (2003) The usage of lateral lumbar BMD in osteoporosis diagnosis,Chinese Journal of Osteoporosis,9(3): 230-234.
- Li N.H.,Ou P.Z.,Yang D.Z.,et al. (2001) The research of osteoporosis in China four regions people,China Public Health,17(10): 917-918.
- Guo Q.S.,Zhang S.B.,Li Z.,et al. (1996) The results of 537 people DEXA test in Shenyang city,Chinese Journal of Osteoporosis,2(3): 70-72.
- Jiang Y.,Liu Z.,Xiao L.P.,et al. (2004) The investigation in 1695 people BMD tests in Tianjin Area,Chinese Journal of Osteoporosis,10(1): 56-59.
- Yang J.,Ni S.K.,SU M.,et al. (1998) The primary discuss of BMD with years and affecting factors,Chinese Journal of Radiology,32(9): 639-640.
- Liu Z.C.,Wang X.H. (2002) The analysis of normal people lumbar BMD in Henan area,Chinese Journal of Osteoporosis,8(2): 102-104.
- Chen Y.A.,Peng T.,Qi K.,et al. (2002) The analysis of adults lumbar BMD in Wuhan area,Modern Medicine,30(2): 74-77.
- Yu W.,Qin M.W.,Xu L.,et al. (1996) The normal people lumbar BMD variety,Chinese Journal of Radiology,30(9): 526-530.
- Li L.,Zhou Q.,Shao J.K.,et al. (2000) The research of normal people lumbar BMD in Taiyuan City,Chinese Journal of Osteoporosis,6(3): 51-53.
- Liu Z.C.,Wang X.H. (2001) The analysis of normal people lumbar BMD in Henan area,Chinese Journal of Osteoporosis,7(2): 136-137.
- Zuo T.J.,Zhou M.X.,Shen Z.X. (1999) The discuss of 1600 persons DEXA examines and diagnostic criteria,Chinese Journal of Osteoporosis,5(3): 13-17.
- Li J.,Yin D.Q.,Zhu L.,et al. (2002) The analysis of normal people lumbar BMD examines,Chinese Journal of Osteoporosis,8(2): 121-123.
- Zhao Y.,Ye W.Z.,Fan Y.P.,et al. (2002) The analysis of BMD in Wuxi area,Chinese Journal of Osteoporosis,8(2): 126-128.
- Guo Q.S.,Sun G.Q.,Zhang S.B.,et al. (2002) The epidemic investigation of normal people DEXA examines in Liaoning area,Chinese Journal of Osteoporosis,8(2): 107-109.
- Li N.H.,Ou P.Z.,Zhu H.M.,et al. (2002) The analysis of China multiple centers standards of normal people osteoporosis examine,Chinese Journal of Geriatrics,22: 3-7.
- Tao G.S.,Wu Q.,Zhang J.L. (1997) The discuss of elders osteoporosis diagnostic criteria,Chinese Journal of Osteoporosis,3(3): 6-9.
- Zuo T.J.,Zhou M.X.,Shen Z.X.,et al. (2002) 5186 people DEXA BMD examines analysis,Chinese Journal of Osteoporosis,8(2): 104-107.
- Tu D.L.,Li J.,Wang X.M.,et al. (2004) The normal people BMD results in Tibet area,Chinese Journal of Osteoporosis,10(2): 299-301.
- Wang X.S.,Ma C.M.,Liu Z.H.,et al. (2004) The research of normal people BMD by RA examines in Beijing Liangfang area,Chinese Journal of Osteoporosis,10(2): 296-298.
- Pang L.P.,Piao J.H.,Liu Z.H.,et al. (2002) The research of normal people BMD by RA examines in Beijing city,Chinese Journal of Osteoporosis,8(1): 35- 37.
- Wang J.H.,Shi P.,Guan Q.Y.,et al. (2004) Beijing normal people phalange’s BMD examines,Chinese Journal of Osteoporosis,10(2): 26-29.
- Liu Z.H.,Pan Z.A.,Wang S.L. (1997) The discuss of primary osteoporosis diagnostic criteria,Chinese Journal of Osteoporosis,3(1): 1-15.
- Liu Z.H. (2002) The Diagnostic Criteria for Primary Osteoporosis and the Incidence of Osteoporosis in China,J Bone Miner Metab,20: 181-189.
- Chen H. (200) 1055 cases BMD analysis in Guiyang area,Journal of Guiyang Medical College,25(2): 142- 143.
- Meng F.G.,Ren X.M.,Xiang R. (2001) 747 cases DEXA examines in Guizhou Liupanshui City,Journal of Zhunyi Medical College,24(1): 59-60.
- Wu Q.,Tao G.S.,Niu S.C.,et al. (1998) The examining accuracy of lumbar BMD,Chinese Journal of Osteoporosis,4(2): 5-8.
- Chen Z.X.,Xu X.M.,Huang G.,et al. (2003) 491 cases DEXA BMD examines in Gansulanzhou area,Chinese Journal of Osteoporosis,9(1): 71-74.
- Huang Q.R.,Zhou Q.,Lu J.H.,et al. (2002) 2111 cases normal women BMD examines in Shanghai area,Chinese Journal of Osteoporosis,8(3): 191-195.
- Liao E.Y.,Wu X.P.,Deng X.G.,et al. (2002) The investigation of women BMD examines in ChinaChangsha area,Chinese Journal of Osteoporosis,8(2): 97-103.
- Li X.J.,Fan H.B.,Zhang X.F.,et al. (2001) The investigation of clinic low back pain patients’ BMD,Journal of the Fourth Military Medical University,22(11): 1048-1050.
- Liao E.Y.,Wu X.P.,Deng X.G. (2000) The investigation of women BMD examines in Changsha area,Chinese Journal of Endocrinology & Metabolism,16(4): 203-208.
- Li J.X.,Ma J.F.,Wu J.,et al. (2000) 1920 cases bone-pain women BMD research in Chengdu city,Modern Preventive Medicine,27(1): 83-85.
- Bao L.H.,Zheng M.D.,Yan A.X. (1997) The research of women lumbar and hip BMD variety,Practical Geriatrics,11(5): 219-221.
- Qin L.L.,Ma H.B.,Zhang W.,et al. (2002) Chinese normal persons BMD examines in the North area,Chinese Journal of Osteoporosis,8(2): 110-103.
- Deng X.G.,Liao E.Y.,Wu X.P. (200) the characters of Chinese women femoral necks and WARD’S area BMD examines,Bulletin of Hunan Medical University,25(2): 95-98.
- Yu W.,Qin M.W.,Xu L.,et al. (1998) the variety of normal persons proximal femoral regions BMD examines,Chinese Journal of Radiology,32(1): 23-26.
- Zhu L.,Yin D.Q.,Li J.,et al. (2003) 1166 cases normal people hip BMD examines,Chinese Journal of Osteoporosis,9(1): 69-71.
- Jiang L.,Chen F.K.,Huang Y.H. (2001) The forearm BMD examines and clinic meanings,Modern Rehabilition,5(12): 108-109.
- Chinese osteoporosis diagnostic criteria (2nd),(2000),Chinese Journal of Osteoporosis,6(1): 1-3.
- Li J.X.,Cai Y.Z. (1997) The osteoporosis diagnostic criteria need discuss,Chinese Journal of Osteoporosis,3(3): 89-91.
- Yang D.Z.,Cheng J.,An Z. (1999) The principle and methods in setting up the primary osteoporosis diagnostic criteria,Chinese Journal of Osteoporosis,5(2): 36-40.
- Fu Y.F. (1996) The osteoporosis diagnostic criteria,Chinese Journal of Osteoporosis,2(1): 1-6.


Open Access Journals
- Aquaculture & Veterinary Science
- Chemistry & Chemical Sciences
- Clinical Sciences
- Engineering
- General Science
- Genetics & Molecular Biology
- Health Care & Nursing
- Immunology & Microbiology
- Materials Science
- Mathematics & Physics
- Medical Sciences
- Neurology & Psychiatry
- Oncology & Cancer Science
- Pharmaceutical Sciences