Zn2+ with Clofibric Acid: A Peroxisome Proliferator-Activated Receptors-Alpha (PPARÃÆà ½Ãâñ) Ligand
Yahia Z Hamada, Aisha Darboe
Yahia Z Hamada* and Aisha Darboe
Division of Natural and Mathematical Sciences, LeMoyne-Owen College, 807 Walker Avenue, Memphis, TN 38126 USA
- *Corresponding Author:
- Tel: 1(901) 435-1392
Fax: 1(901) 435-1424
E-mail: Yahia_hamada@loc.edu
Received date: February 07, 2017; Accepted date: March 09, 2017; Published date: March 15, 2017
Citation: Hamada YZ, Darboe A. Zn2+ with Clofibric Acid: A Peroxisome Proliferator-Activated Receptors-Alpha (PPARα) Ligand. Electronic J Biol, S:2
Abstract
Peroxisome proliferator-Activated Receptors-Alpha (PPARα) ligands are numerous. One such ligand is Clofibric Acid (CA). CA has a chemical structure that has the 2-phenoxy-2-methylpropanoic acid feature. This feature has the right chelation size to bind many metal ions such as Fe3+, Cr3+, Cu2+ and Zn2+. Using potentiometry and spectroscopy, we have found that CA chelates the first member of metal ions of group number 12 in the periodic table (i.e., Zn2+). This chelation occurred in aqueous media in 0.1 M NaNO3 at 25oC. The concentration of Zn2+=2.0 milli molar (2.0 mM). It appeared that, the molar extinction coefficient λmax of free CA is equal to 950 ± 9 M-1cm-1 compared to that of 1756 ± 61 M-1cm-1 for the Zn/CA complex in 1:1 ratio. Further confirmation using IR spectroscopy for the chelation of Zn2+ occurred in the solid phase. In this special issue of Electronic Journal of Biology (eJBio), we have presented two reports for the reaction of the ferric metal ion with CA.
Keywords
Clofibric acid; Zn2+; IR; Potentiometry; UV-Visabsorption
1. Introduction
A detailed literature survey was conducted on August 29, 2016 of all American Chemical Society (ACS) journals to search for relevant papers that dealt with the first member of group 12 metal ions (i.e., Zn2+) and CA. When the term “Zinc” was used in the title of the paper 6,169 papers appeared. When the term “Zinc” was searched again within the abstract of the paper, about 12,009 papers appeared and when the same term was used anywhere in the papers 95,966 papers appeared. The process was repeated with the term Zinc and aqueous solutions. Finally, the process was repeated with the same term, Zinc and CA. These detailed literature reviews reveal that none of the publications that appeared dealt with the interaction of CA with Zinc metal ion, in particular in aqueous media. Figure 1 of the supplementary material shows these data.
For comparison, on August 29, 2016 also, the Directory of Open Access Journals (DOAJ) was used as a non-ACS search engine for articles. It was found that this index contained more than 2.2 million articles. The DOAJ is one of the citation indexes used to cite the Electronic Journal of Biology (eJBio) among other indexes. Surprisingly, only a single article was found that dealt with the key search term Clofibric acid/aqueous solutions [1]. Although ACS and non-ACS search engines have a plethora of literature on the toxicological, biological, medicinal, and chemical information about CA and PPAR, there are no chemical studies of CA with many metal ions under room temperature and in aqueous media [1-9]. Articles 1-9 are just an example of the massive amount of work that was done on PPAR and/or CA. We have recently published few studies of CA with the chromium (III) metal ion (Cr3+) and the copper metal ion (Cu2+) [10,11]. We have also presented two recent reports for the reaction of Fe3+with CA [12,13].
Zinc is an essential component of nearly 300 enzymes [14- 16]. It is found only in +2 oxidation state due to the extra stability associated with the filled d-orbital, thus biological redox reactions are not possible. Its biochemistry is different from the rest of the first row transition metal ions such as iron, manganese and copper due to the partially filled d-orbital of these metal ions. It is second to iron as the most abundant trace element in humans [15,16].
The following are some objectives of the current paper: (1) to determine the extent of CA binding to Zn2+ (2), to identify the nature of the zinc-complexes, and (3) measure the voltage potential of the reaction mixture. As it has been stated before, one can make potentiometry a most useful tool to study metal ions in aqueous solutions [17-20].
2. Experimental Section
2.1 Materials
Solutions of CA were prepared using 99% purity Sigma reagent grade, C10H11ClO3, formula weight 214.6 g.mol-1. Zinc nitrate hexa-hydrate, Zn(NO3)2●6H2O, 98% extra pure Acros organics, formula weight 297.46 g.mol-1. Primary standard potassium hydrogen phthalate (KHP, 99.99%) and solid sodium hydroxide pellets (NaOH, 98%) were purchased from Fisher Chemical Co. We are showing the structural formula of CA in Scheme 1. All pH values of all solutions were adjusted using 0.1271 ± 0.0043 mol.L-1 sodium hydroxide (NaOH) solution that was standardized to the phenolphthalein indicator endpoint. The pH values were measured using either the Orion Membrane pH meter (model 250A) or (model 720) connected to a combination Orion-glass electrode in 0.1 mole.L-1 ionic strength. The ionic strengths were adjusted by the addition of the appropriate 10% v/v of 1.0 M NaNO3 solution.
2.2. Calibration of potentiometry
Each day the pH-electrodes were calibrated using the standard methods shown on the electrode catalogue using two pH-buffer standard solutions; standard buffer solution pH=4.00 and standard buffer solution pH=7.00. However, the pH-meter, the pH-electrode, and the working solutions are further calibrated by titrating standard solution of phosphoric acid (H3PO4). The choice of phosphoric acid is due to the fact that it has three titratable protons in the acidic, the neutral, and the basic buffer regions. H3PO4 has the following pKa-values: 1.92, 6.71 and 11.52 at 25°C and in 0.1M ionic strength as reported in the stability constants Database by Martell and Smith [21]. Supplementary Figure 2 shows the potentiometric titration of free H3PO4. We have overlapped two titrations to show data consistency.
2.3. Solutions used in potentiometry
Sodium Hydroxide (NaOH) solution was always the titrant. We have prepared the NaOH solutions from NaOH laboratory grade pellets in carbonate free water. The detailed methods used to prevent the contamination of the titrant with atmospheric CO2 and to standardize this NaOH solution had been described elsewhere [17-20]. For any data set generated we have calculated the arithmetic mean, the standard deviation, using Excel software. For example, the concentration of NaOH was found to be 0.1271 ± 0.0043 mol.l-1.
2.4. Potentiometry
The details regarding conduction potentiometry have been reported in previous studies [17-20]. In brief, the CA solution was first added to the titration vessel, followed by the addition of the Zn2+ metal ion solution. We adjusted the ionic strength of the solution to 0.1 M by the addition of 10 mL of 1.0 M NaNO3 solution. We adjusted the final volume to 100 μL by adding DI. H2O. This combination gave [Zn2+] to be in the range of 2.0 to 2.5 mmol.l-1. We have added the NaOH solution in the 100 l aliquots by means of very accurate Eppendorf micro-pipette. It appeared that the initial pH-values of the different titrations in the 1:1, or the 1:2 or the 1:3 ratios Zn2+: CA was in the range of 3-4 and the final pH-values were in the range of 10-11. Each titration took about 5 to 6 hours to complete.
2.5. Ultraviolet and visible spectroscopy
We have gathered the UV-Vis spectroscopy spectra by using the T60 high-performance spectrophotometer that was purchased from Advanced ChemTech (Louisville, KY). Samples were prepared in D.I. water at 25oC. The UV-Vis spectrum was scanned from 250 to 550 nm using quartz cuvettes with optical path length of 1 cm. A reference cuvette filled with D.I. water as the control. The concentration of Zn2+ was 3.03 × 10⁻⁴ mol.L-1. The UV-Vis spectra were collected at the pH values of 3.15.
2.6 Infrared spectroscopy
The IR spectra were conducted using the Nicolet iS10 spectrophotometer that is connected to OMNIC software version 8.1. The spectrophotometer was purchased from Thermo Fisher Scientific (Madison, WI). We have prepared the samples neat in their solid state at room temperature. We have scanned the entire IR spectrum from 400 cm-1 to 4000 cm-1 using the provided Attenuated Total Reflectance (ATR) accessory cell compartment. We have set the following data parameters before any data collection: number of sample scans and the number of background scans was set at 32 with resolution of 4.000 cm-1 and Laser frequency of 15798.7 cm-1.
In a typical IR spectrum, the X-axis was set as Wavenumbers in units of cm-1 and Y-axis was recorded as % Transmittance which can easily be converted and displayed into absorbance by means of the OMNIC software program. Background spectra were collected prior to any sample data collection using polystyrene calibration film at which the fingerprint peaks appeared and were identified. We are not trying to correlate the solution chemistry with that of the solid state IR measurements. The IR was collected on the neat solid phase due to the solid state requirements of this spectroscopic technique.
3. Results and Discussion
3.1 Potentiometry of free CA and free zinc metal ion Zn2+
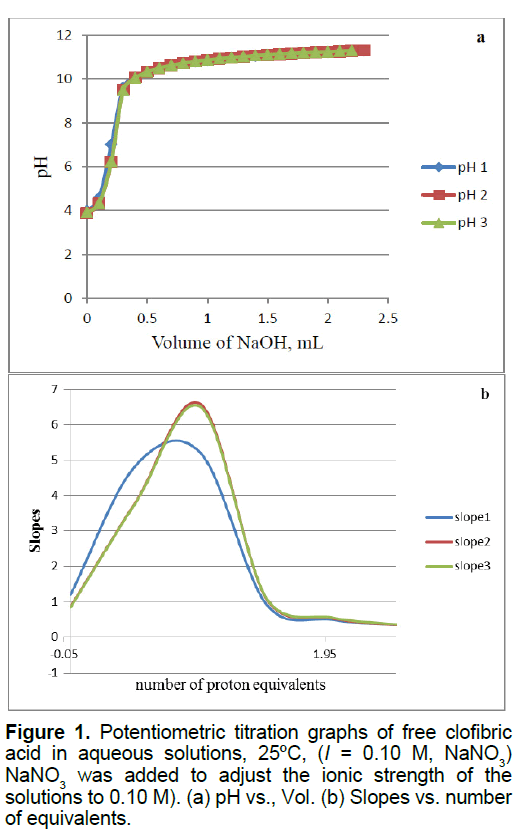
Figure 1 shows the potentiometric titration plots of free CA, we have published another free CA titration curve but these plots shown in Figure 1 is what we have gathered when we reacted CA with zinc in this study. As we have shown before, CA releases one proton out of the carboxylic acid group [10-12]. No data of this ligand (CA) has been reported in the NIST standard reference database of critically selected stability constants of metal complexes [21]. We were able to measure and report the pKa-value for CA in aqueous solutions. CA has a pKa value of 4.32 ± 0.06 [10].
Figure 3 of supplementary material shows the potentiometric titration plots of free Zn2+. This figure shows also the mathematical treatments of the raw potentiometric data. These mathematical treatments are calculated by taking the first derivatives or (slopes) versus the number of measured equivalents of added titrant. It is clear that a divalent metal ion such as Zn2+ consumes a net of two proton equivalents upon titration. This is because metal ions in aqueous solutions under ambient conditions go through metal ion hydrolysis. This term, metal ion hydrolysis, is defined in equations 1 and 2 [22,23]. The number of equivalents is defined as the number of millimoles of added titrant, NaOH in this case, per number of milli-moles of Zn2+ ion present in solution.

3.2 Potentiometry of Zn2+ with CA
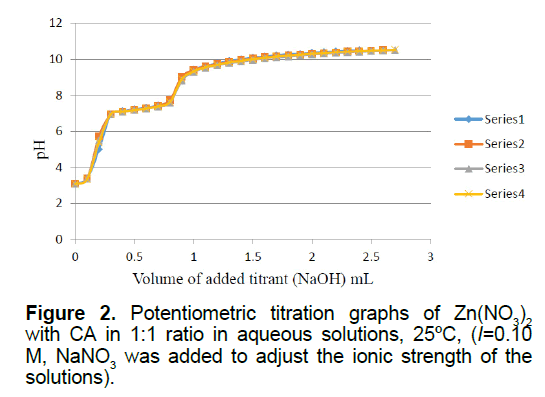
Figure 2 is the potentiometric titration graph of the Zn2+:CA in 1:1 molar ratio. This graph contains a total of four individual plots to show data consistency. This graph shows the exact locations of the minor and the major inflection points. The steepest slope of each plot gives the exact number of protons consumed. For example, the titration plots of the Zn2+:CA in 1:1 molar ratio indicated that the major inflection point has a net of 2.70 ± 0.09 protons consumed. By examining these plots in Figure 3, clearly there has been an interaction between the metal ion Zn2+ and CA due to the shift in the location of the inflection points to 2.70 equivalents; compared to 2.0 equivalents in the titration of the free Zn2+ ion as shown in supplementary Figure 3.
Since the Zn2+:CA in 1:1 ratio replicas overlapped at 2.70 ± 0.09 equivalents, it is clear that an extra 0.7 equivalents of protons has been released from the reaction of Zn2+ with CA. One proton was clearly released from the CA. The source of the other two protons is from the aqua ligand attached to the zinc metal ion (Zn2+). It is established in the literature that such hydroxo-complexes have been seen previously [10-12,21-24]. The most plausible species to be formed in solution will be the ternary Zinc hydroxo-clofibrate complexes [Zn2+(clofibrate-)(OH-)2]1-. We are proposing the solution structure of this ternary Zinc complex in Scheme 2.
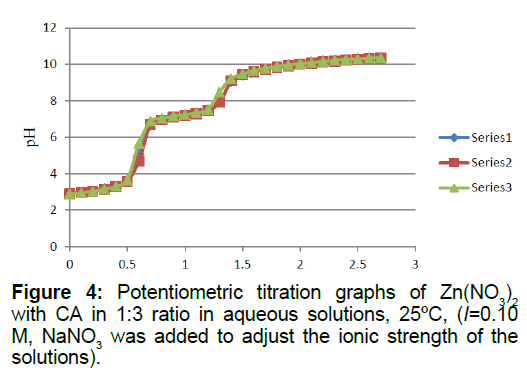
Titrations of the 1:2 and 1:3 Zn2+: CA reaction mixtures are shown in Figures 3 and 4, respectively. It is clear that the presence of an extra mole of CA will increase the net number of protons released into solutions from the Zn2+/CA reaction mixture. An extra 0.92 protons were released from the extra mole of CA present in solution. When the number of moles of CA was increased to 3 (i.e., in the 1:3 titration ratio, Figure 4), it appeared that an extra 0.63 moles of protons was released into solution. A complete summary of the potentiometric data is shown in Table 1.
| Zn2+/CA mole ratio | Number of titration runs | Equivalents of NaOH titrant | Proposed species | Remarks |
|---|---|---|---|---|
| 1:0a | 3 | 2.02 ÃÆââ¬Å¡Ãâñ 0.07 a | Zn(OH)2 | Two H+ were released |
| 0:1b | 3 | 1.04 ÃÆââ¬Å¡Ãâñ 0.04 b | Mono anion of clofibric acid (CA)- | Clofibric acid is a mono-protic acid |
| 1:1 | 4 | 2.70 ÃÆââ¬Å¡Ãâñ 0.09 | [ZnCA(OH)2]- | An Oligomer (Zn-CA-OH) complex |
| 1:2 | 5 | 3.62 ÃÆââ¬Å¡Ãâñ 0.31 | [ZnCA(OH)2]- | An Oligomer (Zn-CA-OH) complex |
| 1:3 | 3 | 4.25 ÃÆââ¬Å¡Ãâñ 0.19 | [ZnCA(OH)2]- | An Oligomer (Zn-CA-OH) complex |
a0.1335 mmol of Zn2+ (3 mL * 0.044485M) were titrated to generate the free Zn2+ curve shown in Figure 3 of supplementary material
b0.0367 mmol Clofibric acid (20 mL * 0.001835 M) were titrated to generate the free clofibric acid curve shown in Figure 1.
Table 1. Potentiometric titration data for (Zn2+ , 0.04449 M) with (CA 0.001835M) in different molar ratios, 25oC.
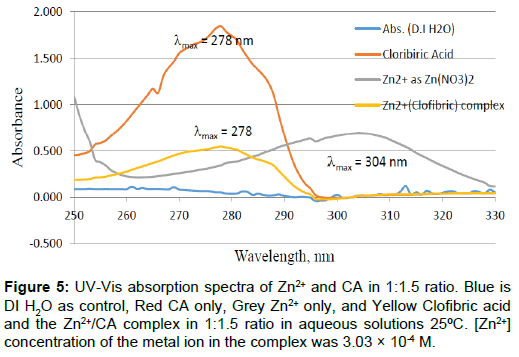
Figure 5: UV-Vis absorption spectra of Zn2+ and CA in 1:1.5 ratio. Blue is DI H2O as control, Red CA only, Grey Zn2+ only, and Yellow Clofibric acid and the Zn2+/CA complex in 1:1.5 ratio in aqueous solutions 25ÃÆââ¬Å¡ÃâúC. [Zn2+] concentration of the metal ion in the complex was 3.03 × 10⁻⁴ M.
The potential response of all of these runs (1:1, 1:2 and 1:3 ratios) showed an almost perfect fit to Nernst Equation [21-23]. Figure 4 of supplementary material is only a representative graph showing the correlation of net solution voltage (mV) vs. the volume of added titrant (ml) in the 1:2 titration ratios. All 1:1, 1:2, and 1:3 titrations showed similar behavior. The voltage changes span the range of about -200 mV to +250 mV. Figure 5 of supplementary material is showing the almost perfect linear regression of the observed pH-values and the net potential in units of mV.
3.3 UV-Vis absorption spectra for free CA, free Zn2+ and that of Zn2+:CA
The UV-Vis absorption spectra for the free CA, the free Zn2+, and that of the Zn2+ to CA in 1 to 1.5 molar ratios are shown in Figure 5. The zinc concentration in the complex was [Zn2+]=3.03 × 10⁻⁴ M. This graph is showing the three spectra overlaid to show the sift in UV-Vis absorption due to the reaction of the Zn2+ metal ion with CA in aqueous solutions at room temperature. The summary of these spectra is given in Table 2. To the best of our knowledge, this is the first study to show the UV-Vis absorption spectra for Zn2+ or CA, or both reacting together under ambient conditions. A most recent accessed of NIST chemistry web book data base on 11-2-2016 showed no such data exist in the database [25].
It is somewhat surprising to observe an electronic transition for the Zn2+ metal ion because of the fact that it is found only in +2 oxidation state due to the extra stability associated with the filled d-orbital (zinc has a d10 electronic configuration), thus no UV-Vis absorption is expected for this colorless metal ion. However, due to the presence of the nitrate as the counter ion associate with the Zn2+ metal ion, we have observed this peak for Zn2+ with a maximum absorption at 302 nm (λmax=302 nm). As mentioned in the experimental section, we have used zinc ion in the form of (Zinc nitrate hexa-hydrate, Zn(NO3)2●6H2O). This peak at 302 nm is due to either n→π* electronic transition or π→π* electronic transition for the nitrate counter ion, but definitely not for the d → d transition of Zn2+ because this transition is forbidden due to the extra stability of zinc d10 configuration.
The peak of the free CA appeared at 279 nm. It is clear that the reason for the appearance of this peak for the colorless CA solution is the π→π* electronic transition of the aromatic ring of CA. The molar extinction coefficient for free CA is in the range of 950 M-1cm-1, ελmax= 279=(950 ± 9). On the other hand, the molar extinction coefficient for Zn2+-CA complex is in the range of ελmax= 277=1756 ± 61 M-1cm-1. The dramatic change in the values of the molar extinction coefficient for the free CA compared to that of Zn2+-CA reaction mixture is a clear indication of strong interaction and chelation [22,24,25].
3.4 Infrared of the Zn2+:CA reaction mixture
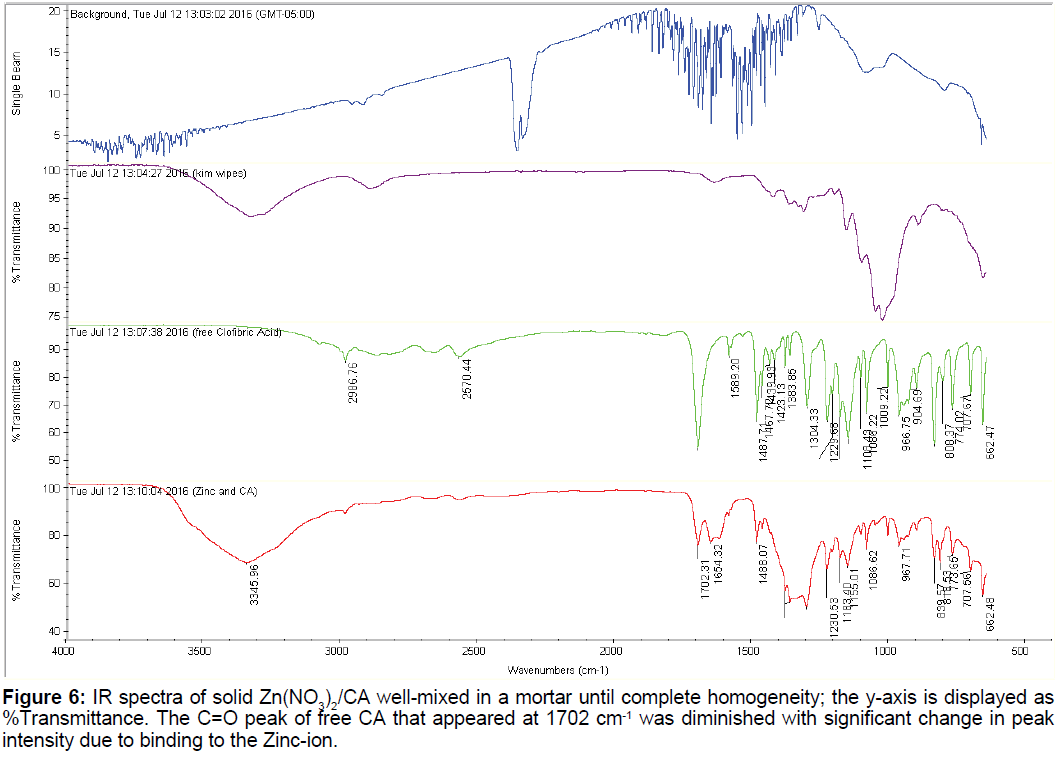
The IR spectra of CA and that of Zn: CA in 1:1 molar ratio is shown in Figure 6. There are at least ten characteristic peaks that appeared for the free CA. We have given a detailed account of these peaks in our recent paper [11]. The most important peak is that of the carbonyl of the carboxylate group C=O that has the characteristic peak of 1702 cm-1. This peak remained in its location upon binding to zinc but was drastically diminished and broadened due to the metal ion binding and chelation.
4. Conclusion
Since we started to study CA and other fibrates, we have learned that literature evidence indicated few research articles appeared for CA with essential and toxic metal ions [10-12]. NIST standard reference database of critically selected protonation constants and stability constants of ligands and their metal complexes does not contain these data for CA. The shift of the location of the inflection point of free Zn2+ titration from 2.0 equivalents compared to that of the zinc/CA complex in all ratios is an evidence of Zn2+ binding and chelation. Based on the number of protons consumed in aqueous solution, we are proposing the formation of the ternary hydroxo-clofibrate zinc complex with the formula [Zn2+(clofibrate-) (OH-)2]1- according to the description in schemes 2. Further calculations are underway to identify the other species that might be present.
| Species/Property | l max (nm) | Absorbance | el max |
|---|---|---|---|
| CA | 279 ÃÆââ¬Å¡Ãâñ 1 | 1.83 ÃÆââ¬Å¡Ãâñ 0.02 | 950 ÃÆââ¬Å¡Ãâñ 9 |
| Zn2+ | 302 ÃÆââ¬Å¡Ãâñ 3 | 0.70 ÃÆââ¬Å¡Ãâñ 0.01 | 14.3 ÃÆââ¬Å¡Ãâñ 0.1 |
| Zn2+:CA in 1:1.5 ratio | 277 ÃÆââ¬Å¡Ãâñ 2 | 0.53 ÃÆââ¬Å¡Ãâñ 0.02 | 1756 ÃÆââ¬Å¡Ãâñ 61 |
Table 2: Maximum absorption of the UV-Vis-peaks that appeared for free Zn2+, free CA, and Zn-CA reaction in 1:1.5 ratio aqueous solutions at 25ÃÆââ¬Å¡ÃâúC. [Zn2+] concentration of the metal ion in the complex was=3.03 ÃÆÃâÃâââ¬â 10-4 M.
Based on the shift of the UV-Vis absorption spectra of the free CA and that of the free Zn2+ metal ion compared to that of the zinc/CA complex is further indication of a binding and chelation. The exact binding sites cannot be confirmed by using either the potentiometric data or the UV-Vis data changes presented above. However, the change in the intensity and the broadness of the most characterized carbonyl peak in the IR spectra at 1702 cm-1 is the indication of the participation of the carboxylate group along with that of the phenoxy oxygen to satisfy the chelate effect usually observed after the first participation of the first binding tooth.
It is worth mentioning here to say that the appearance of the peak at 302 for the free aqueous Zn(NO3)2 solution is due to either, the n→π* electronic transition, or the π→π* electronic transition for the nitrate counter ion, but definitely, not for the d → d transition of Zn2+. This is due to the fact that Zn2+ has an electronic forbidden transition due to the d10 configuration.
We believe that the outcome of the data presented in the current report is novel and useful due to the identification of the ternary or mixed Zn2+-Hydroxo-CA complexes in aqueous solutions at room temperature with a unique molar extinction coefficient of 1756 M-1cm-1 compared to that for the free Zn2+ and free CA. We have chemically identified a novel ternary Zn2+-CA-OH chelate under ambient conditions. We are in the process of measuring the stability constant of CA with these essential meal ions (Fe3+, Cr3+, Cu2+ and Zn2+) which will be more appropriate for journal’s audience such Inorganica Chimica Acta, or Journal of Coordination chemistry or Journal of solution chemistry.
Acknowledgement
We would like to acknowledge the financial support from NSF under Grant # HRD-1332459. Also we would like to acknowledge the financial support of the ACS-SEED summer program to Aishah Darboe.
References
- Schweiger B, Kim J, Jun Kim Y, et al. (2015). Electropolymerized molecularly imprinted polypyrrole film for sensing of clofibric acid. Sensor. 15: 4870-4889.
- Rosse G. (2013). Diphenylpropane derivatives as agonist of PPAR nuclear receptors. ACS Med Chem Lett. 4: 1135ÃÆâÃâââ¬Ãâââ¬Å1136.
- Nevin DK, Peters MB, Carta G, et al. (2012). Integrated virtual screening for the identification of novel and selective Peroxisome Proliferator-Activated Receptor (PPAR) scaffolds. J Med Chem. 55: 4978ÃÆâÃâââ¬Ãâââ¬Å4989.
- Kuwabara N, Oyama T, Tomioka D, et al. (2012). Peroxisome proliferator-activated receptors (PPARs) have multiple binding points that accommodate ligands in various conformations: phenylpropanoic acid-type PPAR ligands Bind to PPAR in different conformations, depending on the subtype. J Med Chem. 55: 893ÃÆâÃâââ¬Ãâââ¬Å902.
- Tu Z, Moss-Pierce T, Ford P, et al. (2013). Rosemary (Rosmarinus officinalis L.) extract regulates glucose and lipid metabolism by activating AMPK and PPAR pathways in HepG2 cells. J Agric Food Chem. 61: 2803ÃÆâÃâââ¬Ãâââ¬Å2810.
- Giampietro lA, Ammazzalorso I, Bruno S, et al. (2016). Amoroso synthesis of Naphthyl-, Quinolin-, and Anthracenyl-Analogues of clofibric acid as PPARa agonists. Chem Biol Drug Des. 87: 467-471.
- Giampietro LA, D'Angelo A, Giancristofaro A. et al. (2014). Amoroso effect of stilbene and chalcone scaffolds incorporation in clofibric acid on PPAR agonistic activity. Med Chem. 10: 59-65.
- Giampietro LA, Ammazzalorso A, Giancristofaro F. et al. Synthesis and biological evaluation of 2-heteroarylthioalkanoic acid analogues of clofibric acids as peroxisome proliferator-activated receptor a agonists. J Med Chem. 52: 6224-6232, 2009.
- Giampietro LA, D'Angelo A, Giancristofaro A, et al. (2012). Amoroso, synthesis and structure-activity relationships of fibrate-based analogues inside PPARs. Bioorg Med Chem Lett. 22: 7662-7666.
- Hamada YZ, Badr MZ, Hayes J, et al. (2016). Ternary metal-hydroxo chelate of Cr3+ with Clofibric acid (CA): A peroxisome proliferator-activated receptors-alpha (PPARa) ligand. J Heavy. Met Tox Dis. 1: 1-8.
- Hamada YZ, Badr MZ, Darboe HA. (2016). Copper-hydroxo chelates of Clofibric acid (CA). Reaction of Cu2+ with CA. J Heavy Met Tox Dis. 1: 1-8.
- Hamada YZ, Rehan S, Scott J. (2017). Clofibric acid: A peroxisome proliferator-activated receptors-alpha ligand forms a ternary complex with the ferric ion. Electronic Journal of Biology. 13: 63-69.
- Hamada YZ. (2016). Completion of Fe3+ UV-Vis absorption between ascorbic acid and clofibric acid. Electronic Journal of Biology. 12: 2-5.
- Vallee BL, Auld DS. (2000). Zinc coordination, function, and structure of zinc enzymes and other proteins. Biochemistry. 29: 5647-1990.
- Cowan JA. (1997). In Inorganic Biochemistry/An introduction, Wiley-VCH Inc. Hoboken, NJ, USA.
- Tietz NW. (1994). Textbook of clinical chemistry, 2nd edition, Carl A. Burtis and Edward R. Ashwood Ed. Saunders, Philadelphia, PA.
- Hamada YZ, Carlson B, Dangberg J. (2005). Interaction of malate and lactate with Cr(III) and iron(III) in aqueous solutions. Syn Reac Inorg Met-Org Nano-Met Chem. 35: 515-522.
- Hamada YZ, Holyfield H, Rosli K, et al. (2009). Equilibrium models of Cr3+ with glutamate. Coord Chem. 62: 721-733.
- Hamada YZ, Carlaon BL, Shank JT. (2003). Potentiometric and UV-Vis spectroscopy studies of citrate with the hexaquo Fe3+ and Cr3+ metal ions. Syn Reac Inorg Metal-Org Chem. 33: 1425-1440.
- Hamada YZ, Bayakly N, Peipho A, et al. (2006). Accurate potentiometric studies of chromium-citrate and ferric citrate complexes in aqueous solutions at physiological and alkaline pH-values. Syn Reac Inorg Met-Org Nano-Met Chem. 36: 469-476.
- Martell AE, Smith RM, Motekaitis RJ. (2001). Critical stability constants database, Version 6.0, NIST, Texas A & M University, College Station, TX, USA.
- Kettle SFA. (1996). Physical Inorganic Chemistry, A Coordination Chemistry Approach, Spektrum. University Science Book, Sausalito, CA.
- Charles F. (1976). The hydrolysis of cations. Baes CF, Mesmer RE. New York: Wiley and Sons.
- Hamada YZ, Harris WR, Rath N. (2013). Crystal structure of Pyridoxal Amino Methyl Phosphonic Acid (PYRAMPA) and its stability constants with Al3+. International J Green Nano Tech. 1: 1-8.
- NIST chemistry web book data base on 11-2-2016.

Open Access Journals
- Aquaculture & Veterinary Science
- Chemistry & Chemical Sciences
- Clinical Sciences
- Engineering
- General Science
- Genetics & Molecular Biology
- Health Care & Nursing
- Immunology & Microbiology
- Materials Science
- Mathematics & Physics
- Medical Sciences
- Neurology & Psychiatry
- Oncology & Cancer Science
- Pharmaceutical Sciences
