Evaluation of Genetic Variation in Rye Germplasm using ISSR Markers
Nastaran Partovi, Mohsen Ebrahimi, Zohreh Alemi
Nastaran Partovi, Mohsen Ebrahimi*, Zohreh Alemi
Department of Agronomy and Plant Breeding sciences, College of Aburaihan, University of Tehran, Tehran, Iran
- Corresponding Author:
- Mohsen Ebrahimi
Department of Agronomy and Plant Breeding sciences
College of Aburaihan, University of Tehran, Tehran, Iran
Tel: 9329844585
E-mail: mebrahimi@ut.ac.ir
Received date: October 27, 2015 Accepted date: December 06, 2015 Published date: February 12, 2016
Citation: Partovi N, Ebrahimi M, Alemi Z, Evaluation of Genetic Variation in Rye Germplasm using ISSR Markers. Electronic J Biol, 12:1
Abstract
Cultivated rye (Secale cereal L.) is a diploid plant used for feeding humans and animals. Closely studying genetic variation is the main component of breeding programs and desirable genetic variation is a prerequisite for selection. In this study, Molecular Variation of 22 Iranian and exotic rye genotypes were evaluated using 15 ISSR primers which 13 of them produced suitable repeatable bands. Result indicated that 761 bands (70%) out of total 1091 bands were polymorphic. Polymorphic information content (PIC) and Shannon's information index (I) were ranged from PIC=0.45, I=0.64, PIC=0.29, I=0.43, respectively. Based on Jaccard similarity matrix, the highest similarity (0.74) was observed among Ethiopia 3 and Palestine genotypes and the lowest similarity was observed among Shapour and Ardebil genotypes with 0.24. Performing cluster analysis using Jaccard similarity matrix and Complete Linkage method resulted in the most suitable groupings which the genotypes were divided in five groups. Generally the results of the study indicated that ISSR markers can be used for grouping rye genotypes.
Keywords
Molecular variation; Rye; Polymorphic information content (PIC); ISSR markers.
1. Introduction
Cultivated Rye (Secale cereal L.) is an annual diploid plant (2n=2x=14), which is used for feeding human and animals [1]. The high tolerance of the plant to undesirable environmental conditions such as drought, frost and tolerance to diseases and pests has directed the attention of plant breeding scholars towards it. Ryes plantation are often performed in cold regions and north Europe [2]. As Rye is compatible to cold regions, its plantation has not been developed in countries with dry warm climates. Since its grain yield and baking quality is lower than wheat, so much attention has not been paid to breeding and producing new varieties of the plant. These have resulted in decreased production and planted areas of Rye [3]. Genetic variation plays a very important role in breeding programs because the hybrids resulted from lines with much more diversity show more heterosis than other closely related origins [4]. Identifying, separating and transferring useful genes native genotypes of plants and their wild relatives are highly important in breeding programs [5]. In plant society's genetic variation may be produced by different methods such as mutation, sexual recombination, immigration and gene flow, genetic drift, interspecific hybridization, polyploids and selection [6]. The study of genetic variation is a process expressing differences and similarities among individuals using certain statistical models and methods in terms of their molecular and morphological traits. The most important achievement is use of molecular biology, using and identifying molecular markers in breeding plants. DNA markers show individual differences at DNA molecular level and have high polymorphisms, genomic random distribution, high frequencies, organs, and tissues. They are unaffected by environmental factors and are growth independent and can be evaluated in laboratories in each step [7]. Molecular markers were used to identify plants and also to genetically analyze existing germplasms for breeding cultivated plants. ISSR markers due to producing many bands with proper repeatability are widely used in genetic variation studies and due to lack of need for identifying DNA sequences, they are considered as less costly markers [8,9]. ISSR markers have been used to study genetic variation and relationships in many cereals such as wheat [10], barley [8], oat [11] and triticale [12]. Studies showed that limited genetic variation studies have been conducted on Ryes using molecular markers particularly ISSR markers. In a study by Pivoriene and Pasakinskiene [13] to investigate genetic variation and determine genetic affinities among 16 Rye genotypes and two Fesulolium (Fesulolium L.) genotypes, out of 33 ISSR markers were used. The results of cluster analysis showed that the studied genotypes were divided into two main groups including Rye group and Fesulolium group. They also reported that 71 percentages of bands showed polymorphism. The results of their study also showed that ISSR markers were effective in separating Rye genotypes. Regarding the importance of Ryes in terms of having genes resistant against stresses such as cold and drought and also due to the fact that there are no reports on the study of genetic variation of Rye genotypes in Iran using ISSR markers, the current study, using ISSR markers, was conducted to estimate the degree of genetic affinities among existing Rye germplasm in Iran.
2. Materials and Method
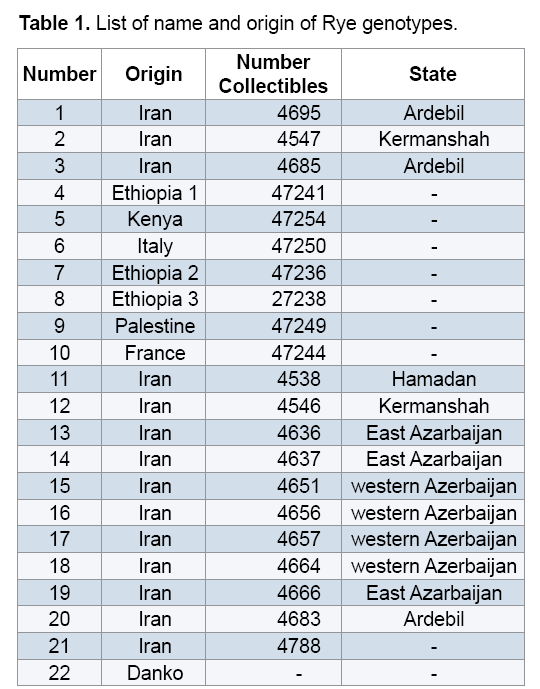
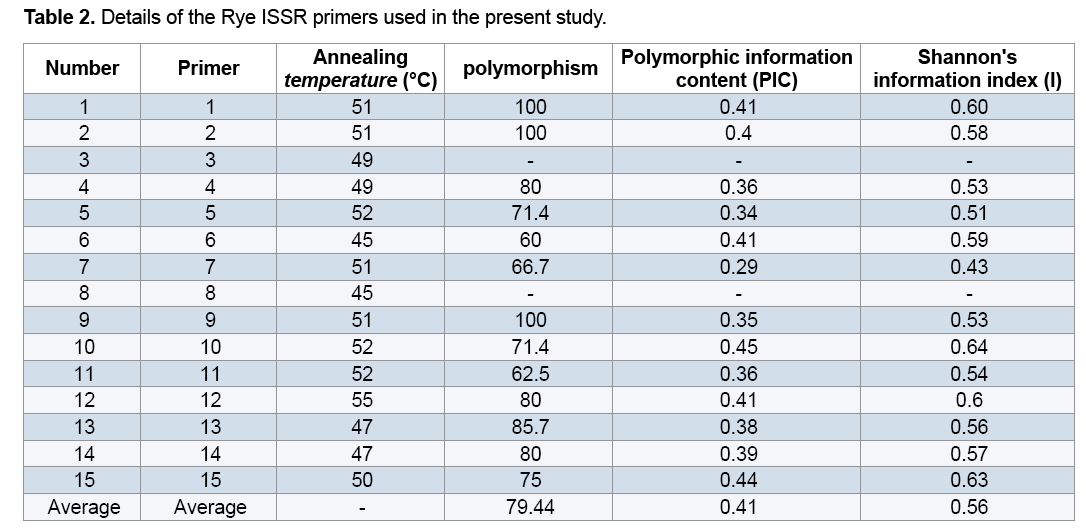
Plant materials used in this study included 22 Rye genotypes (15 genotypes from different regions of Iran along with 7 exotic genotypes) provided from the gene bank of Institute for Breeding and Producing Scions and Seeds of Iran (Table 1). After planting seeds in vases, young leaves were used to extract DNAs. DNA extraction was performed using the modified method of Saghai Maroof [14]. Spectrophotometer and agarose gel methods were used to measure quality and quantity of the DNAs. Fifteen ISSR primers were used to conduct PCR reaction (Table 2). Amplification of DNA extractions in a reaction with the final volume of 15 μl containing 1.50 μl Buffer PCR with the concentration of 10X, 3 μl dNTP with the concentration of 1 mM, 0.30 μl magnesium chloride with the concentration 100 mM, 1.20 μl from each primer with the concentration of 10 mM and 0.10 μl Tag polymerase with the concentration of 5 μl was reached to 12 μl with double distilled water, then adding a concentration of 25 ng/μl DNA to they reached to the final volume. Polymerase Chain Reaction steps included primarily denaturation at 94°C for 5 min, 35 cycles including denaturation at 94°C for 45 seconds, annealing at the desirable temperature of each primer for 45 seconds, extension at 72°C for 1.50 min and final extension at 72°C for 7 min. 1.5% garose gel, tinted with bromide ethidiom and observed under UV were used to study PCR products closely. For the purpose of data analysis, existence and inexistence of bands were identified with numbers of 0 and 1. To measure the percentage of polymorphism, the number of polymorphic segments was divided by the total segments and was multiplied by 100. Polymorphic Information Content (PIC) and Shannon's information index were estimated using Pop Gene 1.31. Similarity matrix was calculated based on Jaccard's coefficient and dendrogram was constructed based on Complete Linkage Grouping and using NTSYS 2.2.
3. Results and Discussion
3.1 ISSR markers
Only two primers out of primers used in the study (I8 and I3) lacked multiplied patterns which could be scored, so they were omitted from calculations. Through studying the remaining primers and the bands obtained from them, a total number of 1091 bands were observed out of which 761(69.70%) bands were polymorphic (Figure 1). Results showed that the highest percentage of polymorphism was related to I1, I2, and I9 primers (100%) and the least percentage was related to the primer I6 (60%). The band pattern of I9 is shown in Figure 1. Generally the amount of polymorphism observed in the study was higher than those obtained by Pivoriene and Pasakinskiene [13] who reported that 6 out of 33 ISSR markers showed the highest amount polymorphism (100%) and 2 markers showed the least amount of polymorphism (20%). Results suggested that the highest amount of Polymorphic Information Content (PIC) was related to I10 and I15 (45% and 44% respectively) the least amount was related to I7 (29%). PIC mean for all primers was calculated as 41% (Table 2).

Figure 1: The band pattern of 22 genotypes of Rye using I9 primer. (To view the name of genotypes refer to Table1), Ladder 1000 bp.
3.2 Cluster analysis
Jaccard similarity coefficients, Dice coefficients and simple comparison were used to measure genetic and family relationships among genotypes and grouping them. The results showed that cophenetic coefficient of dendrogram obtained from Jaccard’s similarity matrix was higher than cophenetic coefficient from the other two methods, so Jaccard’s similarity matrix was selected as the most appropriate coefficient for drawing dendrogram. The results of Jaccard’s similarity matrix indicated that the amount of similarity among the genotypes studied ranged from 0.24 to 0.74, representing high genetic variation among the genotypes in the study. The genetic variation may be caused by nature of cross pollination in Rye, high heterozygosis and genetic recombination in the studied genotypes. The results of the study of genetic distances of genotypes in Jaccard’s similarity matrix showed that the genotypes Ethiopia 3 and Palestine had the highest amount of similarity and the genotypes Shapour and Ardebil had the least amount of similarity (24%). The results of grouping the genotypes based on Jaccard’s similarity matrix showed that the most appropriate genotypes grouping was obtained through Complete Linkage method (Figure 2).
In the obtained dendrogram based on the cutting line through the similarity coefficient 40%, genotypes were categorized into five groups which this represents genetic variations among the genotypes studied. The first group included Khalkhal, Kangavar, Toyserkan, Italy, Ethiopia1, and Ethiopia 2 genotypes, the second one included French and Ebrahimabad genotypes, the third one included Nilshapour and Shapour genotypes, the fourth included Ardebil, Khalilvand, Lanji, Hamzekandi, and Danko genotypes, and the fourth one included Kenya, Abibaran, Ethiopia 3, Palestine, Ashrafabad, Marand Emamkandi, and Khoy Emamkandi genotypes. To study the genetic variation of 16 Rye genotypes and 2 Fesulolium genotypes, Pivoriene and Pasakinskiene [13], using ISSR markers, reported that the genotypes fell into the main group (Rye group) and Fesulolium group.

Figure 2: Dendrogram showing clustering of 22 Rye genotypes constructed using UPGMA based on Jaccard’s coefficient obtained from ISSR analysis.
While they reported that the Rye genotypes were divided into three sub-groups, which suggested there were genetic variations among the Rye genotypes. The results of Jaccard similarity matrix and the dendrogram obtained from cluster analysis indicated that the genotypes Ethiopia 3 and Palestine had the highest genetic similarity, which suggested there was an identical genetic basis among them and might has been transferred to these regions by scholars collecting Rye germplasms. As Shapour and Ardebil genotypes had the least similarity and also were placed in different groups, regarding the variation of the genetics of the two mentioned genotypes the maximum heterosis and transgressive segregation can be achieved through breeding programs [4]. Results suggested that some genotypes related to Iran were placed in the group related to genotypes from exotic and some genotypes from exotic were placed in the group related to Iranian genotypes (Figure 2). Results showed that the origins of genotypes in first group were from three different continents including Asia (Iranian genotypes including Khalkhal, Kangavar, and Toyserkan), Europe (Italy), Africa (Ethiopia 1 and Ethiopia 2) suggesting an identical genetic basis and relationships of the above-mentioned genotypes.
To study the genetic variation among Rye genotypes [15], using microsatellite markers reported that geographical distance is not the reason for away and close genetics of Ryes and genotypes from different countries and continents due to similarity and identical genetic basis were placed in the same group. Generally the results of the study of genetic variation, geographical distance and genotypes farness and closeness in the study showed that geographical distance is not the reason for away and close genetics of individuals. Situate of genotypes related to different ecological conditions in the same cluster may be due to the existence of an identical genetic basis in them, which had been transferred to different regions of the world by scholars collecting germplasms.
3.3 Principal component analysis (PCA)
Results of PCA showed that the first three components justified about 29% of the total changes (Table 3). Although the results may not be statistically appropriate for PCA and graphic display, genetically they suggested the desirable sampling of ISSR markers out of the total Rye genotypes because the more the transmittal of markers in genomes, the less their correlation is and therefore more components are necessary to justify them [16,17]. Studies showed genotypes distribution on a two-dimension diagram obtained from PCA did not conform to groupings from cluster analysis (Figure 3). Results suggested that Kenya, Abibaran, Ethiopia 3, Palestine, Ashrafabad, Emamkandi of Marand, Emamkandi of Khoy, Khalkhal. Kangavar, Toyserkan, Italy, Ethiopia 1, Ethiopia 1, and Ethiopia 2 in the two-dimension diagram obtained from PCA were placed in the same group (Figure 3), while cluster analysis of the above mentioned genotypes had been placed in the two separate groups (groups 1 and 5). The reason for inseparation of the two groups of genotypes in the two-dimension diagram can be attributed to the low relative variance of the first two main components resulting in their separation. It was demonstrated that if the first two components justify 25% of the total variation, PCA encounters problems in genotypes clustering (Melchinger).
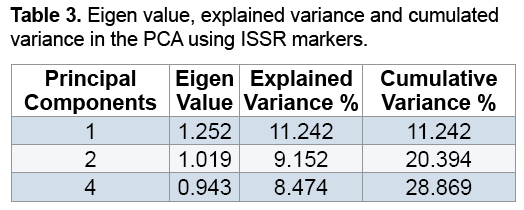

Figure 3: Genetic relationship of 22 Rye genotypes based on principal component analysis.
As in this study, the first two components had justified 20% of the total variation, so it can be stated that this phenomenon led to lack of correspondence of groupings obtained from PCA with results of cluster analysis. It is also believed that when the amount of variation justified with PCA is low; cluster analysis is more effective than PCA to determine genetic relationships among individuals [16]. Generally due to the limitations and advantages of different statistical methods, using them along with knowing factors and different plant growth stages and also had high polymorphism, so it is recommended to make attempts to study phylogenetic relationships of Rye genotypes using molecular markers such as ISSR markers. Results of the study of genetic variations and also geographical distances of the genotypes showed that geographical distance is not the reason for away and close genetics of individuals.
Placing genotypes related to different continents and ecological conditions in a clustering may be due to the existence of an identical genetic basis among them, which has been transferred to different regions all across the world by scholars collecting germplasms [18-23]. Studies suggest that the lack of correspondence of groupings obtained from PCA with the results of cluster analysis can be attributed to low relative variance of the first two principal components, which has led to inappropriate separation of the genotypes. It can be mentioned that when the amount of variations justified with the first two or three components of PCA is low, cluster analysis shows more precise results. Generally, knowing the principles of different statistical methods can help scholars analyze the data accurately and precisely group genotypes.
References
- Barnes JP, Putnam AR. (1986). Evidence for allelopathy by residues and arouse extracts of rye (Secalecereale ). Weed Science. 34 :384-390.
- Akhavan A, Saeidi H,Rahiminejad MR. (2010). Genetic diversity of Secalecereale L . in Iran as measured using microsatellites. GeneticRecourse Crop Evolution. 57 : 415-422.
- Ribeiro M, Seabra L, Ramos A, et al.(2012). Polymorphism of the storage proteins in Portuguese rye (Secale cereale L.) populations. Hereditas. 149: 72-84.
- Bahmankar M, Sadat Noori SA, Mortazavian SM. (2013).Transgressive segregation phenomena in breeding of crop plants. Journal of Applied Crop Breeding. 2 : 175-185.
- Franco J, Crossa J, Ribout JM, et al.(2001). A method for combining molecular markers and phenotypic attributes for classifying plant genotypes. Theoretical Applied Genetic. 103 : 944-952.
- Bagheri A,IzadiDarbandi A, Malbobi MA. (2006). Practical applicationsof plantmolecular biology. FerdowsiUniversity Press, Mashhad, Iran. (In Persian).
- Mohammadi SA,Prasanna BM. (2003). Analysis of Genetic Diversity in Crop Plants-Salient Statistical Tools and Considerations. Review & Interpretation. Crop Science. 43 : 1235-1248.
- Guasmi F, Elfalleh W, Hannachi H, et al.(2012). The use of ISSR and RAPD markers for genetic diversity among South Tunisian Barley. International Scholarly Research Notices: Agronomy. 1-10.
- Alizadeh Z, NabatiAhmadi D, RajabiMemari H, Mohammadi M, Karimizadeh RA. (2016). Assessment of molecular variation in pea germplasm using RAPD markers. Electronic Journal of Biology. 12 : 22-27.
- Sofalian O, Chaparzadeh N, Dolati M.(2009). Genetic diversity in spring wheat landraces from northwest of Iran assessed by ISSR markers. NotulaeBotanicaeHortiAgrobotanici Cluj-Napoca. 37 : 252-256.
- Boczkowska M, Nowosielski J, Nowosielska D, Podyma W. (2014). Assessing genetic diversity in 23 early Polish oat cultivars based on molecular and morphological studies. Genetic Resources and Crop Evolution .61 : 927-941.
- Gradzielewska A, Gruszecka D, Lesniowska Nowak J, PaczosGrz?da E. (2012). Identification of hybrids between triticale and Aegilopsjuvenalis (Thell) Eig and determination of genetic similarity with ISSRs. Genetic and Molecular Research. 11 : 2147-2155.
- Pivoriene O, Pasakinskiene I. (2008). Genetic diversity assessment in perennial ryegrass and Festulolium by ISSR fingerprinting. Zemdirbyste. 95 : 125-133.
- SaghaiMaroof MA, Soliman K, Jorgensen RA, Allard RW. (1984).Ribosomal DNA spacer-lengh polymorphisms in barley: mendelian inheritance, chromosomal location and population dynamics. Proceedings of the National Academy of Sciences. 81: 8014-8018.
- Shang HY, Wei YM, Wang XR, Zheng YL.(2006). Genetic diversity and phylogenetic relationships in the rye genus Secale L. (rye) based on Secalecereale microsatellite markers. Genetic and Molecular Biology . 29:685–691.
- Mohammadi S. (2006). Analysis of molecular data fromperspective of genetic diversity, 9th Iranian crop science congress, Aburaihan Campus-University of Tehran, Tehran, Iran. 96-119.
- Karp A.(1997). Molecular tools in plant genetic resources conservation: a guide to the technologies. Bioversity International.
- Lopes L, Saa O, Alberto Pereiraa J, Baptistaa P.(2012). Genetic diversity of Portuguese Arbutus unedo L. populations using leaf traits and molecular markers: An approach for conservation purposes. ScientiaHorticulturae. 142: 57-67.
- Cheng Z, Ying F, Li D, et al.(2012).Genetic Diversity of Wild Rice Species in Yunnan Province of China. Rice Science. 19 : 21-28.
- Myskow B, Milczarski P, Masojc P.(2010).Comparison of RAPD, ISSR and SSR markers in assessing genetic diversity among rye (Secalecereale L.) inbred lines. Plant Breeding and Seed Science . 62 : 107-115.
- Powell W, Morgante M, Andre C, et al.(1996). The comparison of RFLP, RAPD, AFLP and SSR (microsatellite) markers for germplasm analysis. Molecular Breeding. 2 : 225-238.
- Wang A, Yu Z, Ding D. (2009). Genetic diversity analysis of wild close relatives of barley from Tibet and the Middle East by ISSR and SSR markers. Comptes Rendus Biologies . 332 : 393–403.
- Wolf K, Morgan SM.(1999). The use of RAPD data in the analysis of population genetic structure: case studies in Alkama (Boraginaceae) andPlantago (Plantginaceae) In: P.M, Batman, R.M., Goral, R.G. Molecular Systematic and Plant Evolution. Hollingsworth . 51-73.


Open Access Journals
- Aquaculture & Veterinary Science
- Chemistry & Chemical Sciences
- Clinical Sciences
- Engineering
- General Science
- Genetics & Molecular Biology
- Health Care & Nursing
- Immunology & Microbiology
- Materials Science
- Mathematics & Physics
- Medical Sciences
- Neurology & Psychiatry
- Oncology & Cancer Science
- Pharmaceutical Sciences