Genetic Variation and Biodiversity of Paeonia lactiflora China as Determined by Analysis of ISSR Using Phylogenetic Trees and Split Networks
Siyan Cao, Xubin Meng, Yang Liu, Chuan Shao, Stefan Grünewald, Chengxin Fu, Ming Chen
Siyan Cao1,2,*,Xubin Meng1,2,Yang Liu1,2,Chuan Shao1,Stefan Grünewald3,Chengxin Fu1,Ming Chen1
1College of Life Sciences,Zhejiang University,Hangzhou 310058,China
2Chu Kochen Honors College,Zhejiang University,Hangzhou 310058,China
3CAS-MPG Partner Institute for Computational Biology,Shanghai 200031,China; and Max-Planck-Institute for Mathematics in the Sciences,04103 Leipzig,Germany.
Abstract
Paeonia lactiflora, an important material of Traditional Chinese Medicine (TCM), is widely cultivated in China, but its population genetic structure and phylogenetic relationship remain to be determined. In this paper, Inter-Simple Sequence Repeat (ISSR) markers were used to estimate the genetic variation and biodiversity within and among 24 populations of Paeonia lactiflora in four different provinces across China. Nine UBC primers producing highly polymorphic DNA fragments were selected. Seventy-two discernible DNA fragments were generated of which 71 (98.61%) were polymorphic, indicating substantial genetic diversity at species levels. The genetic diversity measured by the percentage of polymorphic bands (PPB) at population levels ranged from 2.78% to 63.89%. Both programs POPGENE32 and SplitsTree4 were applied to analyze genetic distances among the populations, respectively. We constructed an unweighted pair-group method with arithmetic means (UPGMA) dendrogram using POPGENE32, and a neighbor-joining (NJ) tree and a split network by SplitsTree4. The differences between them were expounded and compared. More complex phylogenetic relationships among populations were discovered and elucidated. Analyses based on the split network were more precise and comprehensive, providing a series of novel conclusions, which may help to standardize and optimize the growth of Paeonia lactiflora.
Keywords
Paeoniaceae; Paeonia lactiflora; ISSRs; Split network; Phylogenetic relationship.
1. Introduction
Paeonia lactiflora is mainly distributed in East Asia. The root of Chinese peony has been used for over 1,500 years in Traditional Chinese Medicine (TCM).
The most medicinally important ingredient is paeoniflorin,which has been shown to have a strong antispasmodic effect on mammalian intestines. It also reduces blood pressure,reduces body temperature caused by fever and protects against stress ulcers [1]. Recently,paeoniflorin was demonstrated to attenuate cognitive deficits and brain damage induced by chronic cerebral hypoperfusion [2].
Traditionally,there are three main breeds of Paeonia lactiflora in China: Hang-paeonia from Dongyang and Pan’an (PA),Zhejiang Province; Bo-paeonia from Bozhou (BZ),Anhui Province; Chuan-paeonia from Zhongjiang (ZJ),Sichuan Province (Figure 1). The three breeds of Chinese peony formed several hundred years ago; their quality,for example,the content of paeoniflorin,is much higher than any other breeds. The three breeds can be cursorily distinguished by their morphological features. However,the phylogenetic relationship between different populations is not very clear,largely because of the wide cultivation as an ornamental and for medicinal use [3]. In the past decade,several phylogenetic analyses on Paeonia lactiflora and its close relatives have been reported [4-8]. However,most of them used DNA sequencing or Random Amplification of Polymorphic DNA (RAPD) [9] markers with samples from a limited number of populations. Additionally,the methods utilized to perform data analysis were conventional. Inter-Simple Sequence Repeat (ISSR) [10] has the advantage over RAPD for its high reproducibility,as well as the great power for detecting polymorphism. Due to these strengths,ISSR becomes a powerful approach for the assessment of genetic variation among related populations,especially for the species in which no molecular genetic information was available.

Figure 1.The sampling locations of three main breeds of Paeonia lactiflora in China. The locations of the populations sampled in this study are shown. HZ: Heze, Shandong Province; BZ: Bozhou, Anhui Province; WH: Wuhu, Anhui Province; PA: Pan’an (located in East China, including XW: Xinwo and YT: Yangtou), Zhejiang Province; ZJ: Zhongjiang, Sichuan Province.
In previous research,phylogenetic relationships were usually represented by using phylogenetic tress,based on the model of evolution dominated by mutations and speciation events. However,under more complex models of phylogenesis,i.e. involving gene loss and duplication,or hybridization,horizontal gene transfer or recombination,a single phylogenetic tree will not often be an appropriate representation of the phylogenetic history or of the different incompatible phylogenetic signals,which necessitates the use of a more realistic model [11]. The combined effect of sampling error and systematic error makes phylogenetics an uncertain science,and network methods provide tools for representing and quantifying this uncertainty [12]. Here,we used a novel program SplitsTree4 (version 4.6,built 4 Aug 2006) [11],to provide a framework for evolutionary analysis using both trees and networks. As the name of the program suggests,it is based on the fundamental mathematical concept of a “split”,that is a bipartition of the taxa set. The program takes as input a set of taxa represented by characters (that is,aligned sequences),distances,quartets,trees or splits and produces as output trees or networks using a number of different methods.
2. Materials and Methods
Plant materials
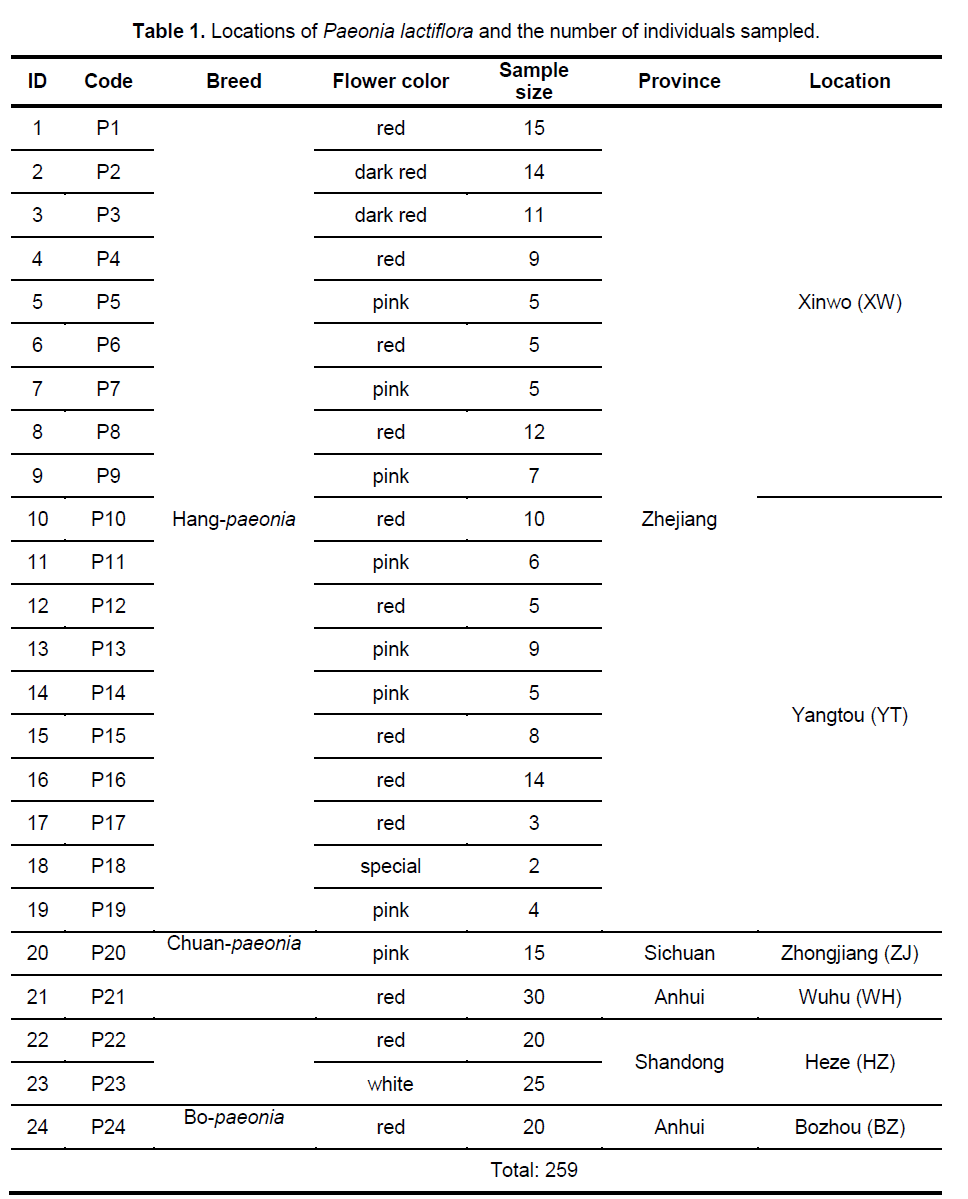
In total,259 individuals from 24 populations were collected from China’s four provinces,whose products serve as important representative and cover the most range of the species distributed in China (Table 1). Young leaf tissue was collected from each sampled individual and dried in silica gel for subsequent DNA extraction (for two times).
Molecular experiments
Total genomic DNAs were extracted using the modified CTAB method [13]. DNA was dissolved in TE buffer,then electrophoresised in 1% agarose to estimate DNA weight. ISSR Primers designed according to sequences published by the University of British Columbia,were synthesized by Sangon Corp.,Shanghai. In the preliminary study,primers that produced polymorphic bands with strong signal and clear background were selected from all 100 primers to perform ISSR-PCR. To ensure the reliability and repeatability,we first optimized the PCR reaction system. Orthogonal experimental design (Suppl. Table 1) was performed to establish highly repetitive,clear and stable experiment parameters including concentration of DNA template,Taq polymerase,Mg2+ and dNTP (No.5) for ISSR,which laid the foundation for future studies of genetic diversity of the populations. PCRs of the same DNA extraction were replicated for three times; the final repeatability is around 90% once optimized. Nine selected UBC primers (Suppl. Table 2) generated 72 bands within 24 populations of Paeonia lactiflora corresponding to an average of 8 bands per primer.
Phylogenetic analyses
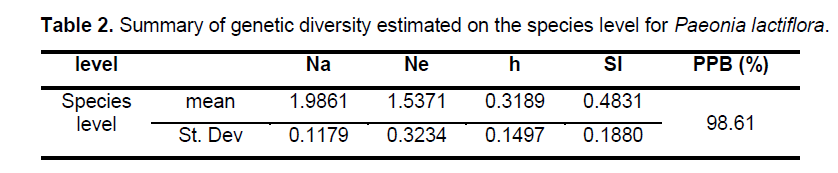
Statistical analyses of ISSR patterns were based on the assumptions that (i) ISSR fragments in Paeonia lactiflora behave as diploid,dominant markers with alleles being either present (amplified) or absent (non-amplified); (ii) co-migrating fragments represent putatively homologous loci; and (iii) most fragments are of nuclear origin and inherited biparentally [9,14]. The presence or absence of a homologous band was scored as 1 or 0,respectively. As for polymorphic sites,only stable differences during repetitive experiments were included for statistical analysis. We calculated the genetic diversity parameters such as the percentage of polymorphic bands (PPB) at the species level,observed the number of alleles per locus (Na),the effective number of alleles per locus (Ne),Nei’s gene diversities (h),and Shannon’s index (SI) with the assistance of POPGENE32 (Table 2). Based on the data above,the coefficient of genetic differentiation between populations (GST),Nei’s genetic distances (D) and genetic identity (I) were acquired.
According to genetic distances among different Paeonia lactiflora populations,POPGENE32 was firstly used to perform cluster analysis for genetic distances among populations. SplitsTree4 was applied to perform analyses for genetic distances,in order to provide a framework for phylogenetic analysis using both trees and networks. A split network is a more general type of phylogenetic graph that can represent any collection of splits,whether compatible or not. For a compatible set of splits,each of them is represented by a single branch,and thus the resulting graph is a tree [11,15]. In general,however,this will not be possible and in a split network a band of parallel edges may be required to represent a single split. Under some complex models of evolution,a single phylogenetic tree will often not be an appropriate representation of the phylogenetic history or of the different incompatible phylogenetic signals,which make it necessary to make use of the more realistic phylogenetic networks [11].
The matrix containing Nei’s genetic distances between all pairs of populations was computed by the POPGENE32 program and used as the input for all phylogenetic structures. We used POPGENE32 to construct the UPGMA dendrogram with bootstrap values and SplitsTree 4 for the NJ tree and the network where we chose the NeighborNet method [16] to construct the latter.
3. Results
The 9 selected primers generated 72 unambiguous and reproducible bands,of which 71 (98.61%) were polymorphic,indicating a very high level of interspecific genetic variation in Paeonia lactiflora. Genetic diversity varied significantly among populations with PPB values ranging from 2.78% (P15) to 63.89% (P14),with the average being 20.72%. Shannon’s index (SI) and Nei’s gene diversities (h) also showed a similar trend (Figure 2 ). On the population level,h varied from 0.0109 to 0.2271,with an average of 0.1229,and SI ranged from 0.0161 to 0.4153,with an average of 0.1765. The mean observed number of alleles (Na) ranged from 1.0417 to 1.6389,while the mean effective number of alleles (Ne) varied from 1.0251 to 1.3402 (Suppl. Table 3). Among the 24 populations investigated,P14 exhibited the highest level of variability while P15 possessed the lowest value of variability. When calculated across populations,the h- and SI-values equaled 0.3189 and 0.4831,respectively; and the Na- and Ne-values equaled 1.9861 and 1.5371,respectively. Table 2 shows the summary of genetic diversity estimates on the species level for Paeonia lactiflora.
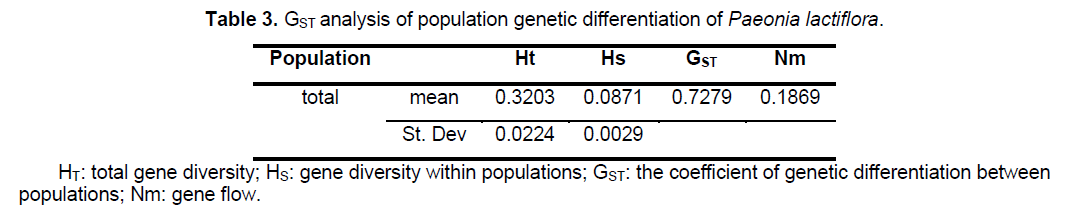
analysis of the population genetic structure revealed a considerable level of genetic differentiation among the 24 populations of Paeonia lactiflora investigated. The total gene diversity (Ht) and gene diversity within populations (Hs) were 0.3203 and 0.0871,respectively. GST analysis shows most of the total variation (72.79%) was found among populations,whereas only 27.21% occurred among individuals within populations,indicating a high level of genetic variation at the species level. The level of gene flow (Nm,the number of migrating individuals among populations per generation) was estimated to be only 0.1869 (Table 3). The genetic distances,based on the allele frequencies of the ISSR markers,were calculated for each pair of populations to estimate the extent of their divergence (Suppl. Table 4). Estimates of Nei’s genetic distances ranged from 0.0665 between P21 and P22 to 0.7555 between P13 and P19; while Nei’s genetic identity ranged from 0.4423 between P1 and P19 to 0.9356 between P12 and P16.

Figure 3.UPGMA dendrogram of Nei’s genetic distances among populations of Paeonia lactiflora (by POPGENE32). I: the Pan’an populations (including all the populations sampled in Pan’an except P17, P18 and P19); II: the non-Pan’an populations. The numbers next to some internal nodes are bootstrap values based on 1,000 cycles in bootstrap analysis (only values higher than 50 are indicated).
The UPGMA cluster analysis generated by POPGENE32 recognized two major groups. The first group represented all the populations in Pan’an except 3 populations (Figure 3 ,I). All other populations formed the second group (Figure 3 ,II). We will use Group II and Split II to refer to this group and the corresponding split. Based on NJ and NeighborNet (implemented in SplitsTree4),we obtained a phylogenetic tree (Figure 4 ) and a split network (Figure 5 ). The NJ tree contains Split II but differs significantly from the UPGMA dendrogram. In the split network Split II is again one of the highest-weighted splits. However,many edges are needed to represent it because several splits which are not compatible with Split II are displayed as well. Although the network can display more splits than a single tree,the NeighborNet does not support some splits from the UPGMA dendrogram and the NJ tree. The split network contains many little “boxes” which indicates the complexity of phylogenetic relationships and necessitates further analysis.

Figure 4.NJ tree of Nei’s genetic distances among populations of Paeonia lactiflora (by SplitsTree4).
4. Discussion
Based on the present ISSR investigation,the populations of Paeonia lactiflora possess a fairly high level of polymorphism with PPB that equalled 98.61%. This is in contrast to the previously detected value (PPB = 63.64%) based on RAPD markers [8]. Such a high level of polymorphism would make ISSR a valid technique in elucidating genetic differentiation in Paeonia lactiflora populations.
Accurate estimates of genetic diversity are useful for optimizing culturing strategies and for managing the genetic diversity of the populations [17]. In this work,the levels of genetic diversity detected among the 24 populations are unequal with respect to the h value. The highest h value was found in P14 and the second lowest value in P1 and P16. The differences do not seem to correlate with the sample size. For instance,population P1 and P16 with moderate sample sizes possesses a low genetic diversity value,while population P14 with a relatively small sample size among the 24 populations contains a high h-value.
POPGENE32 and SplitsTree4 were used to analyze the phylogenetic relationship among 24 populations of Paeonia lactiflora from their genetic distances. Based on the UPGMA implementation in POPGENE32 we constructed a dendrogram (Figure 3 ); while based on NJ and NeighborNet (implemented in SplitsTree4) we obtained a phylogenetic tree (Figure 4 ) and a split network (Figure 5 ),respectively.

Figure 5.NeighborNet of Nei’s genetic distances among populations of Paeonia lactiflora (by SplitsTree4). Each band of parallel edges indicates a split. For instance, the two bold lines in this graph represent the split {P1, P4} versus all other taxa. The distance between any two taxa ÃÆïÃâÃÂÃâá and β corresponds to the sum of weights of all splits separating ÃÆïÃâÃÂÃâá and β, that is, the sum of the edge lengths of any shortest path between the two [12].
Most of the differences between the UPGMA dendrogram and the NJ tree can be explained by the fact that UPGMA assumes a constant rate of evolution and NJ does not. For example,the populations P17,P20,P21,P22,P23 form a strongly supported cluster in the UPGMA dendrogram as the distances within the group are small compared to the distances to populations outside of the group. However,if it is not required that all populations are equally far away from the root,the overall distance matrix can be better represented by a tree where the populations in the UPGMA cluster are not monophyletic. Nevertheless,the difference between the two trees,especially the different position of P14,suggests that the distance table might not be very tree-like. This is also indicated by the observation that P19 is one of the taxa with the shortest distance to P14 but in the NJ tree they are far away from each other.
Therefore,it is not surprising that the NeighborNet exhibits a lot of incompatibility. Split II is one of the splits with highest weight but several splits that are incompatible with Split II are displayed,too. All of them group P14 together with some of the Pan’an populations that are not in Group II. This pattern is typical for a reticulate evolution event in which P14 should be involved. Since P14 had the highest genetic diversity (PPB) among all the populations involved,it is quite possible that its phylogenetic status was affected by many other populations. We reconstructed the split network without P14. Although the overall structure was not changed,it became less “boxy”.
Definitely,the phylogenetic relationship between P14 and other populations was highly incompatible. Furthermore,P14 and P11,P13,P19 are located within a small area,with the same flower color,but they were not closely related in any tree or the network. The conventional standards based on morphological and geographical characteristics may not be reliable enough,especially when the phylogenesis is complex. One reason is the introduction in recent several hundred years; in addition,the importance of flower color may be unreasonably amplified.
As previously mentioned,the phylogenetic relationships between several populations in the split network differ from both trees. For example,neither the split separating P3,P7,P11,P14,P5,P2 (Figure 4 ,III) from the other taxa,nor the split grouping together all those taxa except for P14,the cluster with the second highest bootstrap support in the UPGMA dendrogram is supported by the NeighborNet. Although it is not always apparent from the network what kind of reticulation has happened and which populations were involved,all these incompatibilities and disagreements between the network and the trees indicate non-treelike phylogenetic events [12],such as natural expansion (e.g. hybridization),especially introductions of Paeonia lactiflora by farmers in the history.
Recently,it was reported that using the UPGMA and NJ method in ISSR fingerprint analyses led to similar phylogenetic conclusions [18]; but in this work,different algorithms gave birth to trees with different patterns and phylogenetic information. The discrepancy might be related to the species investigated and the methods used in molecular experiments. Understandably,research in other aspects such as morphology and isozymes may help determine the reliability of each algorithm used on a certain set of data. Moreover,there is an important difference between phylogenetic trees and the more general split networks. Any rooted tree has a direct interpretation in evolutionary terms: the leaves represent taxa and the internal nodes represent last common ancestors of some of the taxa. In a split network,the internal nodes do not have such a direct interpretation. Instead,they must be viewed on a more abstract level as networks giving a visual representation of incompatible signals,that is,showing how “tree like” or “certain” parts of a phylogeny are [12]. But how to explain the information containing in the network and its relationship between conventional dendrograms is still a challenge. In this paper,taking all the dendrograms constructed by different algorithms into consideration,we proposed that a split network can be seen as a combination of several trees,each of which lose some information when constructed according to their own algorithms. Since a NeighborNet can display more splits than a tree,no matter whether compatible or incompatible,this algorithm makes it possible to study the detailed relationship between any two populations investigated. We also observed that some splits are contained in the NeighborNet that are not supported by any tree while some splits from the trees are not displayed by the network.
With the assistance of the phylogenetic status and some relationships discovered,our study is useful to pick candidate populations for chemical analysis of Paeonia lactiflora in China. First of all,the phylogenetic status of Paeonia lactiflora of the three breeds has been altered significantly in recent several hundred years,mainly due to introduction; but their morphological characteristics have not been changed so much. As a result,the flower color and geographic location are no longer appropriate criteria for distinguishing different breeds; new molecular methods should be developed. Moreover,because of the decreased purity of the three breeds,it is very possible that the quality is no longer as high as before. Therefore,further studies may use the approaches of natural product chemistry to find out the population with highest quality,and to help recover the quality of Paeonia lactiflora in China.
In this work,we presented some original conclusions based on the split network and the comparison among distinct graphs. Together with the novel algorithm,these results open the door for further research,which might necessitate more background information,such as introduction and hybridization in the history. The analytical method based on SplitsTree4 was used to analyze the detailed phylogenetic relationship for the first time. Its advantage has already been demonstrated in this paper,and we predict that this method may draw more attention in the future and can be used in broader scope.
Acknowledgements
This work was partially supported by the National Natural Science Foundation of China (No. 30500106,No. 30670139),the Department of Science and Technology of Zhejiang Province,China (No. 2007C22025,No. 2006C13077),and by the Scientific Research Foundation for the Returned Overseas Chinese Scholars,State Education Ministry,China.
Supplementary Data
Available at https://www.cls.zju.edu.cn/binfo/paeonia/
References
- Page M. (1997) The Gardener’s Guide to Growing Peonies. David & Charles. Newton Abbot.
- Liu J.,Jin D.,Xiao L.,Zhu X. (2006) Paeoniflorin attenuates chronic cerebral hypoperfusion-induced learning dysfunction and brain damage in rats. Brain Res. 1089: 162-170.
- Hong D.,Pan K.,Turland N.J. (2001) Paeoniaceae. In: Wu Z.Y. and Raven P.H. (eds.) Flora of China. Science Press and Missouri Botanic Garden Press,6: 127-132.
- Sang T.,Crawford D.J.,Stuessy T.F. (1995) Documentation of reticulate evolution in peonies (Paeonia) using internal transcribed Spacer sequences of nuclear ribosomal DNA: Implications for biogeography and concerted evolution. Proc. Natl. Acad. Sci. USA. 92(15): 68l3-6817.
- Sang T.,Crawford D.J.,Stuessy,T.F. (1997) Chloroplast DNA phylogeny,reticulate evolution,and biogeography of Poeonia (Paeoniaceae). Amer. J Bot. 84: 1120-1136.
- Zhang D.,Sang T. (1999) Physical mapping of ribosomal RNA genes in peonies (Paeonia,Paeoniaceae) by fluorescent in situ hybridization: Implications for biogeography and concerted evolution. Amer. J Bot. 86(5): 735-740.
- Zhou H.T.,Hu S.L.,Guo B.L.,Feng X.F.,Li J.S.,Yan Y.N. (2002) A Study on genetic variation between wild and cultivated populations of Paeonia lactiflora pall. Acta Pharm Sin. 37(5): 383-388.
- Chen B.L.,Hang Y.Y.,Zhou Y.F.,Guo K.Y.,Huang C.H.,Li Z. (2003) Genetic diversity and relationship of different populations of original plants of Radix Paeonia Alba. J Plant Resour. Environ. 12(2): 17-21.
- Williams J.G.,Kubelik A.R.,Livak K.J.,Rafalski J.A.,Tingey S.V. (1990) DNA polymorphisms amplified by arbitrary primers are useful as genetic markers. Nucleic Acids Res. 18(22): 6531-6535.
- Wolfe A.D.,Xiang Q.Y.,Kephart S.R. (1998) Assessing hybridization in natural populations of Penstemon (Scrophulariaceae) using hypervariable inter simple sequence repeat markers. Molecular Ecology. 7: 1107-1125.
- Huson D.H.,Bryant D. (2006) Application of phylogenetic networks in evolutionary studies. Mol. Biol. Evol. 23(2): 254-267.
- Huson D.H. (1998) SplitsTree: A program for analyzing and visualizing evolutionary data. Bioinformatics. 14(10): 68-73.
- Ma Z.G.,Lv Z.Z.,Zhou H.B.,Wang Z.R. (2006) The preliminary application of ISSR marker in taxonomy of pleurotus species. J Huazhong Agr. Univ. 25(1): 55-59.
- Arafeh R.,Sapir Y.,Shmida A.,Iraki N.,Fragman O.,Comes H.P. (2002) Patterns of genetic and phenotypic variation in Iris haynei and I. atrofusca (Iris sect. Oncocyclus the royal irises) along an environmental gradient in Israel and the West Bank. Mol. Ecol. 11: 39-52.
- Xu K. (1999) Biological Mathematics,Science Press,Beijing,pp. 142-143.
- Bryant D.,Moulton V. (2004) NeighborNet: an agglomerative algorithm for the construction of phylogenetic networks. Molecular Biology and Evolution. 21: 255-265.
- Hamrick J.L.,Godt M.J.W. (1996) Conservation genetics of endemic plant species. In: Avise J.C.,Hamrick J.L. (eds.) Conservation Genetics,Chapman & Hall,New York,pp. 281-304.
- Meimberg H.,Abele T.,Bräuchler C.,McKay J.K.,Pérez de Paz P.L.,Heubl G. (2006) Molecular evidence for adaptive radiation of Micromeria Benth. (Lamiaceae) on the Canary Islands as inferred from chloroplast and nuclear DNA sequences and ISSR Wngerprint data. Mol Phylogenet Evol. 41: 566-578.


Open Access Journals
- Aquaculture & Veterinary Science
- Chemistry & Chemical Sciences
- Clinical Sciences
- Engineering
- General Science
- Genetics & Molecular Biology
- Health Care & Nursing
- Immunology & Microbiology
- Materials Science
- Mathematics & Physics
- Medical Sciences
- Neurology & Psychiatry
- Oncology & Cancer Science
- Pharmaceutical Sciences