ECG Feature Extraction for Stress Recognition in Automobile Drivers
Supriya Goel, Pradeep Tomar, Gurjit Kaur
School of ICT, Gautam Buddha University, India
Received date: February 23, 2016; Accepted date: March 17, 2016; Published date: March 24, 2016
Citation: Goel S, Tomar P, Kaur G, ECG Feature Extraction for Stress Recognition in Automobile Drivers. Electronic J Biol, 12:2
Abstract
Mental stress is one of the well-known major risk factors for many diseases such as Hypertension, Coronary Artery Disease, and Heart Attack. This research paper places the emphasis on ECG signal processing for recognition of stress. Feature extraction of ECG is done with the help of lab view and then those features which are affected are classified. Results shown that ST wave, QRS wave, T wave and isoelectric level of ECG gets affected.
Keywords
BVP; ECG; EEG; GSR; HR; HRV; MA; PLI.
1. Introduction
Biomedical signal processing is an important visualization and interpretation method that helps in the extraction of vital information from biomedical signals. Various methods have been proposed by considering the ways in which these components interact to recognize stress, but at the moment there isn’t any single formulation that is universally acceptable for all components. Recognition and modeling of stress with every component is a very challenging problem that has drawn a great deal of interest from the emerging field of Human- Computer Interaction (HCI). In the real world, stress recognition through HCI has vast application in the field of medicine, entertainment, education, safety etc. [1,2]. Researchers and practitioners use a large variety of signals like facial expressions, gestures, vocal traits which collectively known as behavioral modalities and physiological signals like ECG, Electroencephalograph (EEG), Galvanic Skin Response (GSR), Electromyogram (EMG) Blood Volume Pressure (BVP), Heart Rate (HR), Heart Rate Variability (HRV), Temperature (T) and Respiration Rate. A major drawback of, using behavioral modalities for emotion recognition is the uncertainty that arises in the case of individuals who either are consciously regulating their emotional manifestations or are naturally suppressive. For instance, although facial expressions can be analyzed to determine emotions, there is no guarantee that an individual will express the corresponding condition, irrespective of whether they are experiencing a certain emotion. This has serious implications in some applications such as surveillance [3].
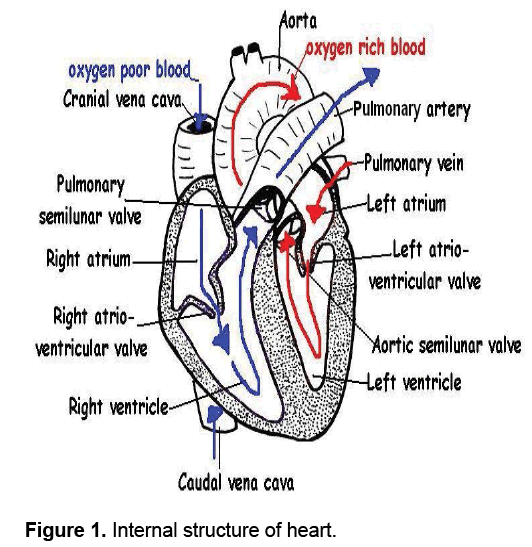
An interesting alternative in place of behavioral modalities is the physiological signals (or bio signals) which constitute vital signs of the human body and the benefits of detecting emotions by using physiological signals which are involuntary reactions of the body and these involuntary reactions are very difficult to hide. These signals have traditionally been used for clinical diagnosis, because according to past research these signals have significant evidence to suggest that they are sensitive to and may convey information about emotional states [1-6]. These Physiological signals are captured through sensors which help in conveying the information about stress. This work considers heart as main part of the body to detect the physiological signal for stress recognition as it is affected by the emotions. So it is important to study the impact of stress recognition on the heart as the pattern of ECG signal changes during positive or negative emotion [7,8]. The human heart weighs 250-350 grams and is approximately equal to the size of the fist. It is located anterior to the vertebral column and posterior to the sternum The Heart is divided into separate right and left sections by the inter-ventricular septum. Each of these (right and left) sections is again divided into upper and lower compartments known as atria and ventricles respectively. The atria are the receiving chambers and the ventricles are the discharging chambers as shown in the Figure 1. The Tricuspid valve separates the right atrium from the right ventricle. The Mitral (also known as the Bicuspid) valve separates the left atrium from the left ventricle.
Oxygen-poor blood from the whole body is received into the right atrium through large veins called the superior and inferior vena cava and flows [9-14]. The right ventricle then pumps the blood to the lungs where the blood is oxygenated. Similarly, the left atrium and the left ventricle together form a pump to circulate oxygen-enriched blood received from the lungs (via the pulmonary veins) to the rest of the body [15].
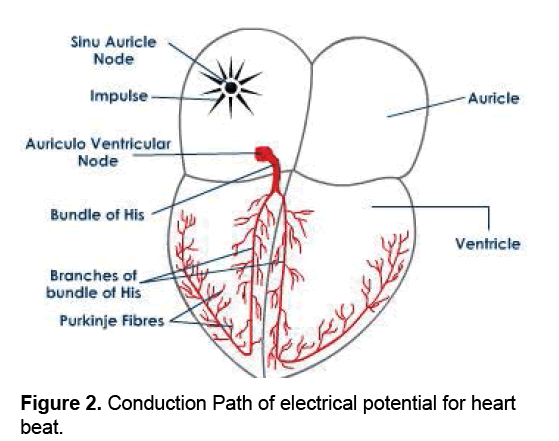
The electrical potentials for contraction are caused by a group of specialized cells in the heart which control the heartbeat. These cells produce electrical impulses which spread across the heart causing it to contract. Following the start of atrial depolarization, the impulse quickly arrives at the Atrio-ventricular node (AV node) which is responsible for the contraction of ventricle. The time required for the signal to travel from the AV node to the Purkinje Fibers provides a natural delay of about 0.1 second. This delay ensures that the atria have become completely empty before the ventricles contract. The contraction is followed by ventricular repolarization (recovery) of the cells, which were excited during the previous depolarization wave.
The SA node creates the electrical impulse which causes the heart to beat, but the Autonomic Nervous System (ANS) controls the heart rate and the strength of heart contractions. The ANS consists of two parts, the Sympathetic Nervous System (SNS) and the Parasympathetic Nervous System (PNS). The Sympathetic nerves increase the heart rate and the contraction force, while the Parasympathetic nerves act in the reverse manner. An idealized conduction of electrical impulse for heart beat is shown in Figure 2.
ECG leads actually display the instantaneous differences in potential between the electrodes. The ECG waveforms are labelled alphabetically, beginning with the P wave, which represents atrial depolarization. The QRS complex represents ventricular depolarization, and the ST-U complex (ST segment, T wave and U wave) represents ventricular repolarization. The QRS-T waveforms of the surface ECG corresponds in a general way obtained ventricular action potentials, the intracellular recordings from single myocardial fibers. The rapid upstroke of the action potential corresponds the onset of QRS. The Plateau corresponds to the isoelectric ST segment, and active repolarization corresponds to the inscription of the T wave [2]. The QRS complex is subdivided into specific deflections or waves. If the initial QRS deflection in a particular lead is negative, it is termed as a Q wave; the first positive deflection is termed an R wave. A negative deflection after an R wave is an S wave. An entirely negative QRS wave is termed a QS wave (Figure 3).
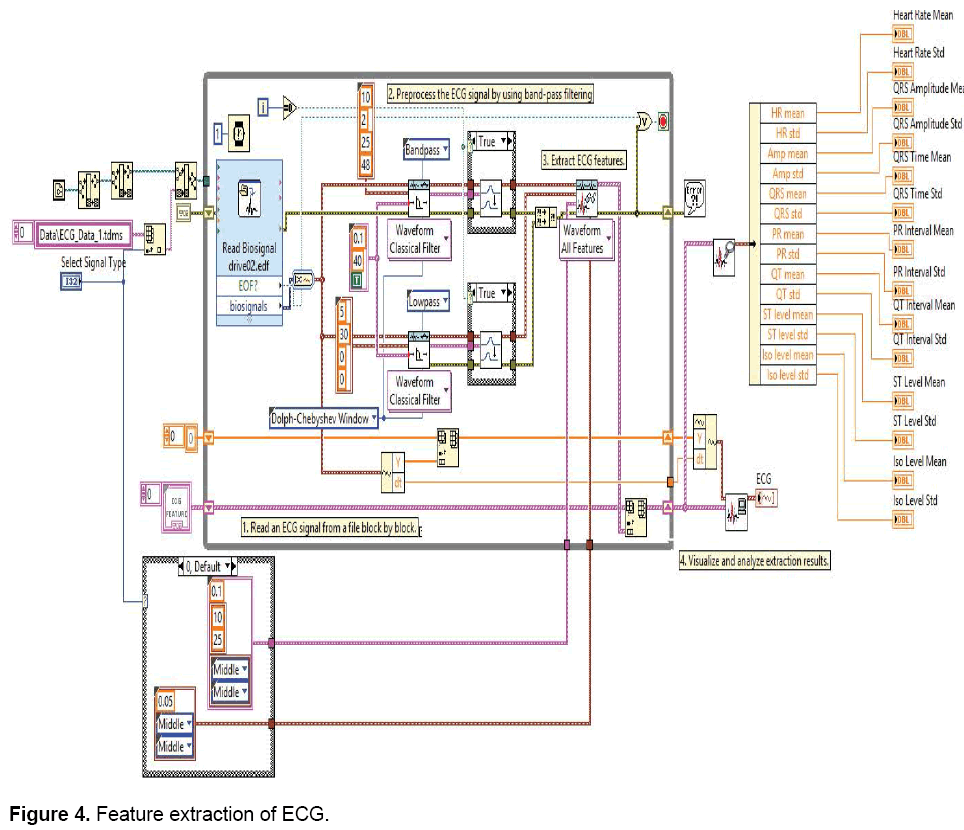
The ECG feature extraction system provides fundamental features (amplitude and intervals) to be used in the subsequent automatic analysis. In recent times, a number of techniques have been proposed to extract features. The previously proposed method of ECG signal analysis was based on time domain method. But this is not always adequate to study all the features of ECG signal so therefore the frequency representation of a signal is required to extract the features. The extracted feature from the ECG signal plays a vital role in emotion recognition and deviations in the normal electrical patterns indicate various features to detect the emotions [13]. So the development of accurate and quick methods for automatic ECG feature extraction is of major research area. Therefore, it is necessary that the feature extraction system performs accurately. The purpose of feature extraction is to find as few factors as possible within ECG signal that would allow successful abnormality recognition and efficient prognosis [14]. The process of emotion recognition based on the above said features that are based on ECG pattern, has four following main steps like affective data acquisition, affective feature extraction, affective feature subset selection and classifier design. Researchers and practitioners usually found the ECG signal pattern used for feature extraction is usually corrupted with noise from various sources, including imperfect contact of electrodes to the body, machine malfunction, and electrical noise from elsewhere in the body, respiration and muscle contractions [15-18]. So, efficient emotion recognition from ECG signals it is necessary to remove noise from ECG signal. The ECG is a vital signal of the human body, and as such, it naturally provides aliveness detection, robustness to attacks, universality and permanence. In addition, ECG is inherently satisfying uniqueness requirements, because the morphology of the signal is highly dependent on the particular anatomical and geometrical characteristics of the myocardium in the heart [19]. The ECG signal describes the variation of electrical activity of the heart over time. It is recorded non-invasively with electrodes attached at the surface of the body. Traditionally, physicians use the ECG to gain insight on heart conditions, while usually complementary tests are required to finalize a diagnosis. However, from a biometrics perspective, it has been demonstrated that the ECG has sufficient detail for identification, emotional recognition and many other applications. Several noises contaminate the ECG signal while recording. Filtering ECG signals help us to eliminate those signals that contaminate our reading. These contaminating agents can be classified in the following categories [20] like line interference, noise by contact in the electrode and electrical coupling of the electrodes and the board. The noise, whatever the source is, significantly contaminates the ECG signal and therefore makes its analysis difficult. Obtaining an ECG signal could be an easy task, but obtaining a reliable ECG signal to provide a clinic analysis by a specialist is a more complicated task [21], this is why manipulating and filtering a signal is a complex task. The predominant artifacts present in the ECG include Baseline Wander, Power Line Interference (PLI), Muscle Artifacts (MA) and Motion Artifacts (EM) (Figure 4).
These artifacts strongly affects the ST segment, degrades the signal quality, frequency resolution, produces large amplitude signals in ECG that can resemble P-QRS-T waveforms and masks tiny features that may be important for clinical monitoring and diagnosis [22]. The goal of ECG signal enhancement is to separate the valid signal components from the undesired artifacts, so as to present an ECG that facilitates easy and accurate interpretation [23-26]. In this feature extraction method signal is filtered by using wavelet method. Feature extraction is most important step for stress recognition. Important features which are vital for stress recognition are extracted in lab view with the help of data flow modeling. A set of eight features are extract with the help of Lab view. Data is taken from MIT Database. The Database contains physiological signals of drivers under stressed conditions and normal conditions. Data is converted into .edf format as it is a suitable format for Lab view. As it contains ECG, respiration rate, heart rate and other physiological signals but our focus is to study ECG signals.
2. Features Affected by ECG
There are mainly four features which are affected by stress mainly QRS wave, Isoelectric level, ST wave and T wave. When a person is in stress its heart beats increase, due to which its Isoelectric level increases and Sodium Potassium pump gets activated. Also, there is QRS waves get widened due to the action potential cycle rate gets increased. To localize ST elevation with the help of ECG leads is more useful than non ST elevation ischemia. By ST elevation or by increased T wave positivity there will be chances of acute transmural anterior wall ischemia. This causes high blood pressure or blockage of a coronary artery causes by rupture of atherosclerotic plaque. Major causes of ST elevation are emotional stress. Other factors are high blood pressure, high cholesterol level, poor diet and intake of excess alcohol. After ST elevation there will be increases in T wave. Earliest signs of acute infarction followed by a period ranging from hours to days by evolving T wave inversions and often by Q waves in same lead distribution. Earliest signs of acute infarction, followed This ST wave elevation and changes in T wave known as Tako-tsubo stress cardiomyopathy. Due to stress there will be a delay in propagation of electrical conduction system which results in QRS widening. QRS widening has hazardous effects on human beings also a reason of critical cardiac arrest.
3. Results and Analysis
This feature extraction method is applied to the set of motor drivers which are in stress. From the results, it is found that iso-electric level increases in those drivers which are in stress as compared to those drivers which are relaxed. When QRS wave is compared and their correlation factor is extracted, then it comes to be 0.7 in those drivers which are stressed. Also Tako Tsubo syndrome is also seen in stressed drivers as ST wave is also highly correlated in stressed drivers (Table 1 and Figure 5).
| Subject Pairs | Auto Correlation | |
|---|---|---|
| SUB1 | SUB2 | 0.9075 |
| SUB1 | SUB3 | 0.9261 |
| SUB1 | SUB4 | 0.9478 |
| SUB1 | SUB5 | 0.8021 |
| SUB2 | SUB3 | 0.8880 |
| SUB2 | SUB4 | 0.8027 |
| SUB2 | SUB5 | 0.8684 |
| SUB3 | SUB4 | 0.8318 |
| SUB3 | SUB5 | 0.8856 |
| SUB4 | SUB5 | 0.6424 |
Table 1. Iso-electric level (auto correlation).
4. Conclusion
Heart is most sensitive part of the human body and it is highly affected by stress. From the feature extraction method, it is concluded that ST wave, QRS wave, T wave and isoelectric level of ECG is highly affected by stress, which is not good for human health. So it is necessary to provide some stress busters so as to decrease bad impacts of stress.
References
- Agrafioti F, Hatzinakos D, Andeson AK. (2012). ECG Pattern Analysis for Emotion Detection in IEEE. Transactions on Affective Computing. 3: 273-280.
- Sinha R, Lovallo WR, Parsons OA. (1992). Cardiovascular Differentiation of Emotions. Journal of Psychosomatic Medicine.54: 422-435.
- Picard RW, Vyzas E, Healey E. (2001). Toward Machine Emotional Intelligence: Analysis of Affective Physiological State in IEEE. Transactions on Pattern Analysis and Machine Intelligence.23: 1175-1191.
- Benovoy M, Cooperstock J, Deitcher J. (2008). Bio-signals Analysis and its Application in a Performance Setting-Towards the Development of an Emotional-Imaging Generator. Proceedings of the 1st International Conference on Biomedical Electronicsand Devices, Bio-signals, Madeira, Portugal.36: 253-258.
- Nakasone A, Prendinger H, Ishizuka M. (2005). Emotion Recognition from Electromyography and Skin Conductance. Proceedings of the 5th International Workshop onBiosignal Interpretation. 219-222.
- Anttonen J, Surakka V. (2006). Emotions and Heart Rate While Sitting on a Chair. Proceedings of the International Conference on Human Factors in Computing Systems. 491-499.
- Lee C, Yoo S, Park Y, et al. (2007). Using Neural Network to Recognize Human Emotions from Heart Rate Variability and Skin Resistance. Proceedings of 27th Annual International Conference of the Engineering in Medicine and Biology Society. 5523-5525.
- Healey J, Picard R. (2005). Detecting Stress during Real-World Driving Tasks using Physiological Sensors in IEEE. Transactions onIntelligent Transportation Systems. 6: 156-166.
- Honig F, Batliner A, Noth E. (2007). Real-Time Recognition of the Affective User State with Physiological Signals.Proceedings of the 2nd International Conference on AffectiveComputing and Intelligent Interaction.1-8.
- Kim K, Bang S, Kim S. (2004). Emotion Recognition System using Short-Term Monitoring of Physiological Signals. Journal of Medical and Biological Engineering Computing.42: 419-427.
- Picard R. (2003). Affective Computing Challenges. International Journal of Human-Computer Studies. 59: 55-64.
- Mandryk R, Inkpen k. (2004). Physiological Indicators for the Evaluation of Collocated Collaborative Play. Proceedings of the ACM Conference on ComputerSupported Cooperative Work (CSCW04). 102-111.
- Haag A, Goronzy S, Schaich P, Williams J. (2004). Emotion Recognition Using Bio-sensors: First Steps Towards an Automatic System. Springer -Verlag Berlin Heidelberg. 36-48.
- Jones C, Troen T. (2007). Biometric Valence and Arousal Recognition. Proceedings of the 19th Australasian Conference on Computer-Human Interaction, New York. 191-194.
- Ya X, Min H, Wanhui W. (2004). Analysis of Affective ECG signals Towards Emotion Recognition,” in proceedings of the ACM. Conference on Computersupported cooperative work (CSCW04).102-111.
- Mandryk R, Atkins S, Inkpen K. (2006). A Continuous and Objective Evaluation of Emotional Experience with Interactive Play Environments. Proceedings of the SIGCHI Conference on Human Factors in Computing Systems (CHI 06 ), New York. 1027-1036.
- Chang-Wei M, Min H. (2005). An Application of Electrocardiography to Emotion Recognition. Proceedings of Innovative Approaches to Evaluating Affective Interfaces (CHI 2005), Portland. 180-186.
- Moien S, Atkins M. (2007). Intelligent ECG Signal Noise Removal using PSONN.International Journal of HumanComputer Studies.65: 329-347.
- Muthulakshmi S, Latha K. (2012). Classification of ECG Waveform Using Feature Selection Algorithm in IEEE. International Conference on Advanced Communication Control and Computing Technologies (ICACCCT). 480-487.
- Cowie R, Douglas-Cowie E, Savvidou S, et al. (2005). Feeltrace: An Instrument for Recording Perceived Emotion in Real Time. Proceedings of iSCA Workshop Speech and Emotion. 19-24.
- https://www.comm.utoronto.ca
- Wasmund WL, Westerholm EC, Watenpaugh WE, et al. (2002). Interactive Effects of Mental and Physical Stress on Cardiovascular Control. Journal of Applied Physiology. 92:1828-1834.
- Pramila R, Sims J, Brackin R, Sarkar N. (2002). Online Stress Detection Using Psychophysiological Signals for Implicit Human- Robot Cooperation. Journal of Robotica.20: 673-685.
- Dambacher M, Eichinger W, Theisen K, Frey AW. (1994). RT and Systolic Blood Pressure Variability after Sympathetic Stimulation during Positive Tilt in Healthy Volunteers,” in proceedings of Computers in Cardiology. 32: 573-576.
- Andrassy G, Zabo A, Ferencz G, et al. (2007). Mental Stress may Induce QT-Interval Prolongation and T-Wave Notching. Journal of Annals of Noninvasive Electro cardiology.12: 251-259.
- Simon BP, Eswaran C. (1997). An ECG Classifier Designed Using Modified Decision Based Neural Network. Journal of Computers andBiomedical Research. 30: 257-272.

Open Access Journals
- Aquaculture & Veterinary Science
- Chemistry & Chemical Sciences
- Clinical Sciences
- Engineering
- General Science
- Genetics & Molecular Biology
- Health Care & Nursing
- Immunology & Microbiology
- Materials Science
- Mathematics & Physics
- Medical Sciences
- Neurology & Psychiatry
- Oncology & Cancer Science
- Pharmaceutical Sciences


